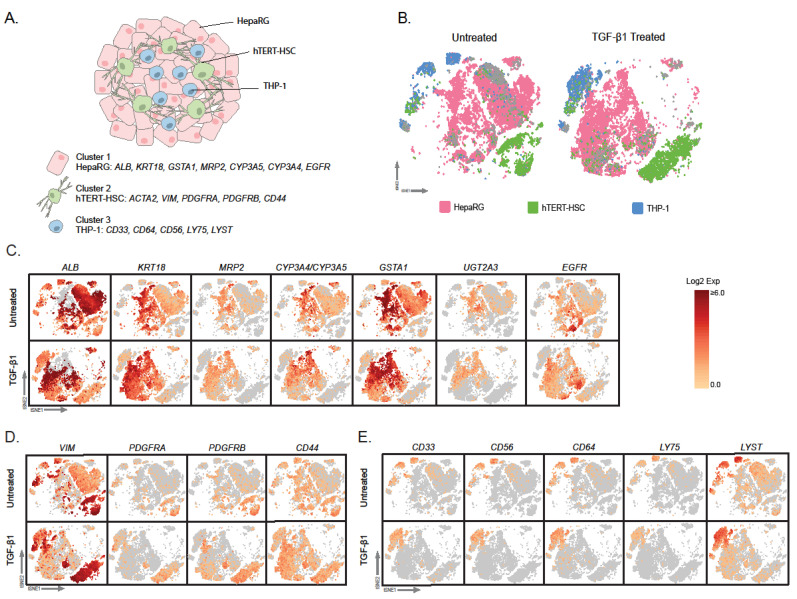
Figure 5.
Expression of cell-specific markers in the identified cell clusters. Pre-processed single cell sequencing data was analysed using CellLoupe. Schematic representation of the composition of multicellular MTs and known cell type-specific markers (A). Supervised clustering based on the cell type-specific markers in untreated and TGF-β1-treated samples led to the identification of HepaRG (pink), hTERT-HSC (green) and THP-1 (blue) and cells that did not cluster based on the chosen genes (grey) more detail can be found in methods section “Gene-based identification of specific cell clusters“ (B). Examples of marker expression for HepaRG (C), hTERT-HSC (D) and THP-1 (E) in untreated and TGF-β1-treated samples. As ACTA2 is also a fibrotic marker it is shown in Figure 7. Data are expressed as log2 expression (selected markers shown in tSNE plots).

