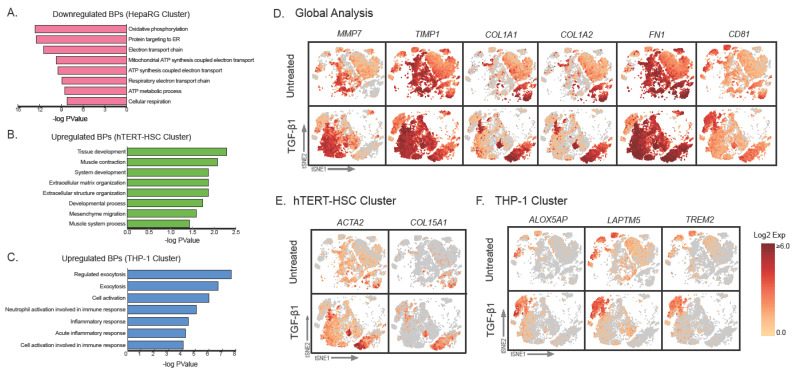
Figure 7.
Visualization of fibrosis-relevant markers Specific effects on genes of interest are shown based on the scRNA-seq data to identify cell-specific responses. The responses of individual cell clusters (supervised method) to TGF-β1 (1 ng/mL) treatment for 48 h were evaluated to identify treatment-related cell specific changes in gene expression. Significantly differentially expressed genes (LogFC p < 0.05) for each cell type were identified and using gProfiler to identify the corresponding biological pathways and expressed as −log (p Value). A total of 48 significantly downregulated genes were identified for treated HepaRG (A), 25 significantly upregulated genes for hTERT-HSC (B) and 45 significantly upregulated for THP-1 (C). Graphs D–F represent expression changes of specific genes: Genes that were significantly regulated in the global TGF-β1 treated sample vs. untreated (D) treated hTERT-HSC cluster vs. untreated hTERT-HSC cluster (E) and THP-1 cluster vs. untreated THP-1 cluster (F). Data are expressed as log2 expression (selected markers shown in tSNE plots).

