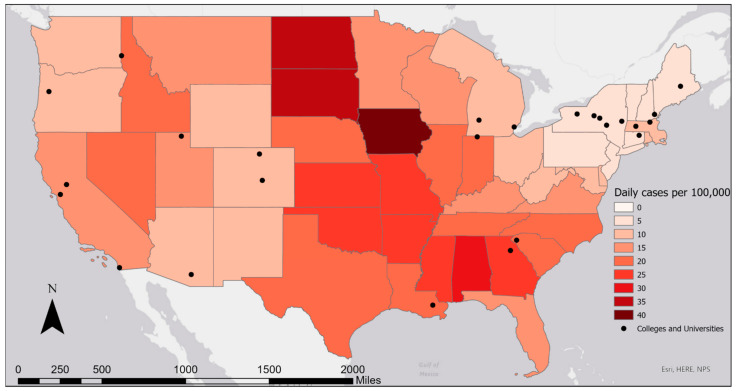
Figure 1.
Map showing location of case study colleges and average daily number of COVID-19 cases per 100,000 population during the last week of August 2020, by state. Data from Centers for Disease Control and Prevention, 2020 [40]. Note: A single dot in Utah, Oregon, and Maine represents a system of more than one university in each state that work together on wastewater surveillance.

