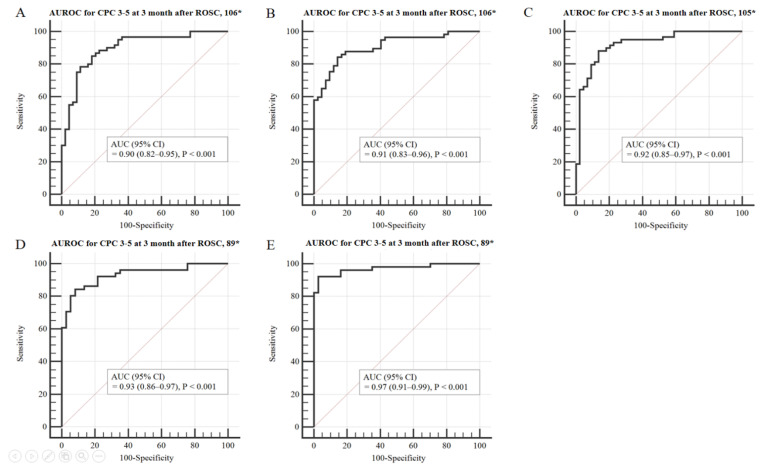
Figure 3.
Area under the curve (AUC) to predict poor neurological outcome 3 months post-OHCA in the modified CAHP model. The ROC curve for the M-CAHP model is shown in panel (A); the ROC curve for the M-CAHPNSE model is shown in panel (B); the ROC curve for the M-CAHPGWR model is shown in panel (C); the ROC curve for the M-CAHPPV400 model is shown in panel (D); the ROC curve for the M-CAHPHSI model is shown in panel (E). Abbreviations: CAHP, cardiac arrest hospital prognosis; ROC, receiver operating characteristics; NSE, neuron-specific enolase; GWR, grey/white matter ratio; PV, percentage of voxel; HSI, high signal intensity; CI, confidence interval. * Number of patients included in the analysis.

