Figure 7.
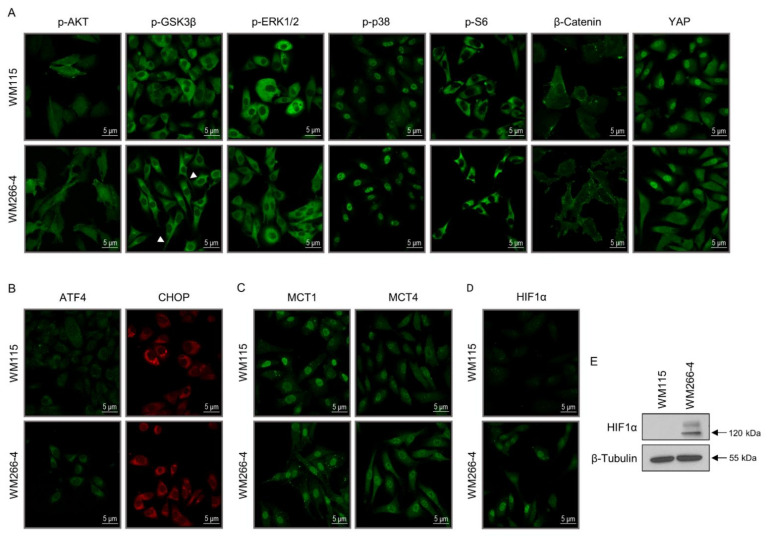
Signaling signatures of the IMC program in BRAFV600D-dependent melanomagenesis. (A) Immunofluorescence patterns of the “p-AKT”, “p-GSK3β”, “p-ERK1/2”, “p-p38 (MAPK)”, “p-S6”, “β-catenin”, and “YAP” signal transduction-related proteins in WM115 (primary) and WM266-4 (metastatic) melanoma cells. “p”: Phosphorylation. “β”: Beta. Arrowheads: “p-GSK3β”-positive invadopodia. Scale bars: 5 μm. (B) Immunofluorescence profiles of the “ATF4” and “CHOP” ER-stress/UPR-related proteins in WM115 (primary) and WM266-4 (metastatic) melanoma cells. “ER”: Endoplasmic reticulum. Scale bars: 5 μm. (C) Immunofluorescence patterns of the “MCT1” and “MCT4” Monocarboxylate (Lactate) transporters in WM115 (primary) and WM266-4 (metastatic) melanoma cells. Scale bars: 5 μm. (D) Immunofluorescence profiles of the “HIF1α” transcription factor in WM115 (primary) and WM266-4 (metastatic) melanoma cells. “α”: Alpha. Scale bars: 5 μm. (E) Western blotting examining the “HIF1α” expression profiles in WM115 (primary) and WM266-4 (metastatic) human BRAFV600D-positive melanoma cells. “β-Tubulin” served as the protein of reference (control). “α”: Alpha. “β”: Beta. Molecular weights of the “HIF1α” and “β-Tubulin” (major) proteins are shown by numbers at the right side of each respective panel. (E) Protein quantification values (in bar-chart format) are shown in Figure S1.

