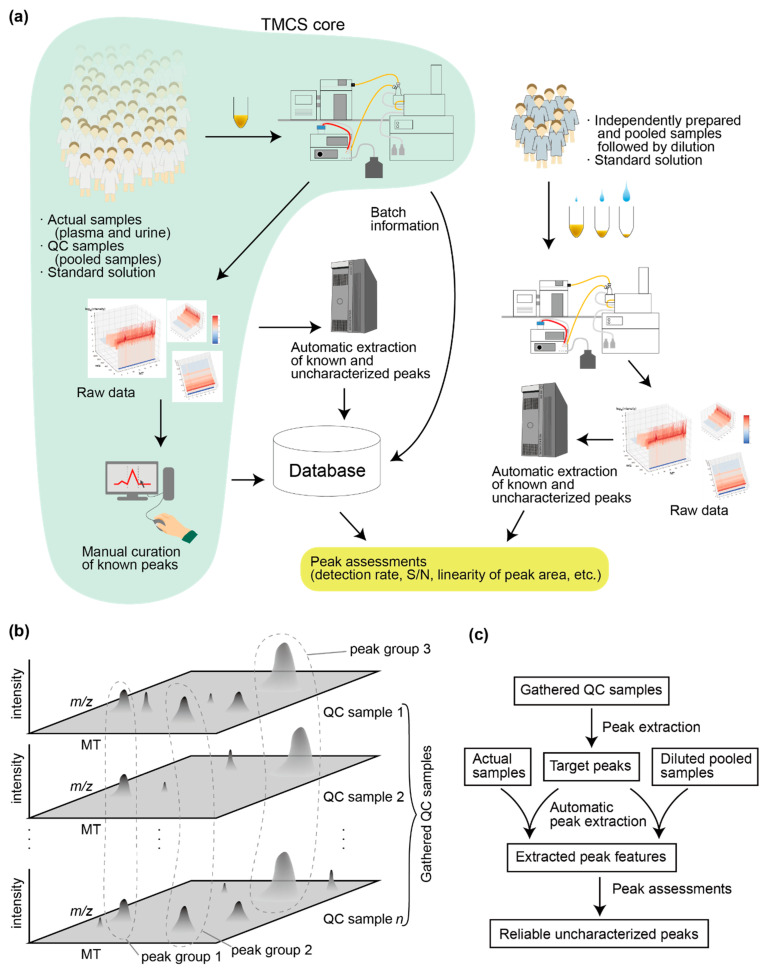
Figure 1.
Overview of the pipeline used in the present study and determination of target peaks. (a) Overview of the data collection and peak processing/extraction pipeline. The routine used in the Tsuruoka Metabolome Cohort Study (TMCS) is labeled as “TMCS core”. The other procedures are specific to the present study. In the TMCS routine, the characterized peaks are manually curated, whereas in the present study, the peaks were processed automatically. (b) Determination of target peaks using 30 randomly selected quality control (QC) samples. The peaks in the 30 gathered QC samples were aligned and clustered to form “peak groups” that had similar m/z and migration times (MTs). Ideally, each peak will correspond to a specific metabolite. (c) Overview of the peak processing/extraction pipeline focusing on the data flow for filtering reliable uncharacterized peaks. Our proprietary software MasterHands was used for peak extraction.

