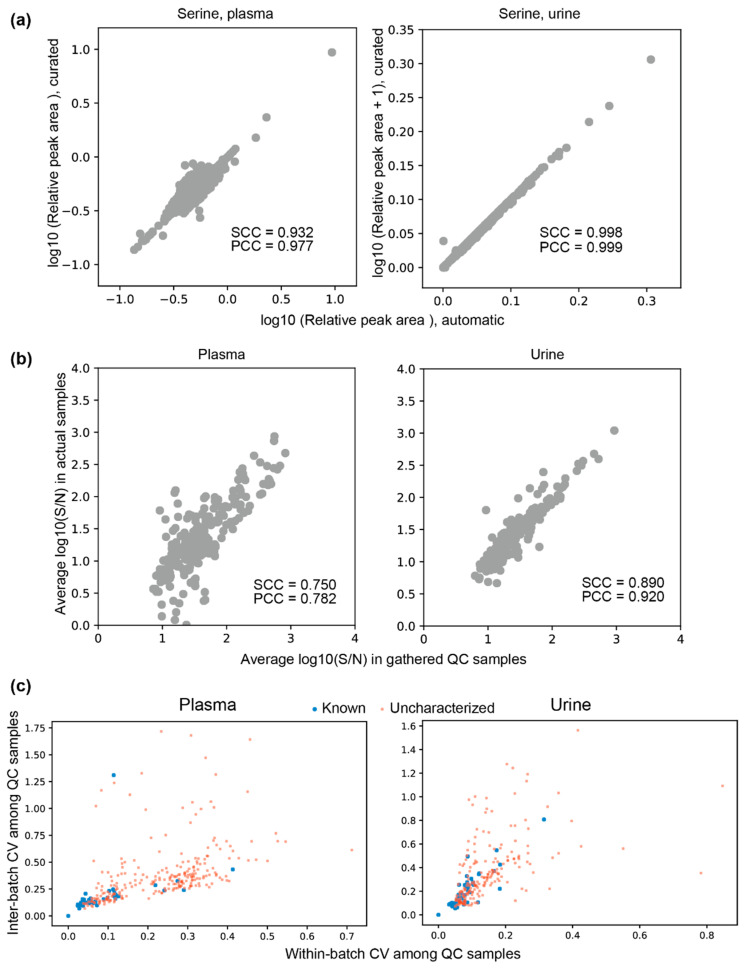
Figure 4.
Characteristics of peaks automatically extracted from actual samples and quality control (QC) samples that were measured together within the same batches. (a) Plots of relative peak areas that were determined automatically against peak areas that were curated manually. The results for serine are shown. (b) Plots of average signal-to-noise (S/N) ratios of uncharacterized peaks in the QC samples against the corresponding S/N ratios in the actual samples. (c) Plots of within-batch coefficient of variations (CVs) against inter-batch CVs of relative areas of known and uncharacterized peaks among QC samples. The points at (0,0) indicate the internal standard. SCC, Spearman’s correlation coefficient; PCC, Pearson’s correlation coefficient.

