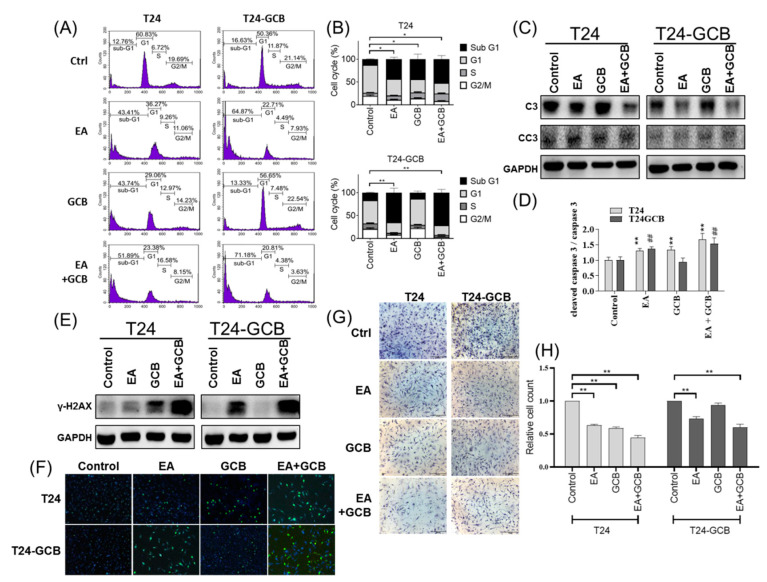
Figure 2.
(A) Comparison of the cell cycle distribution of T24 and T24-GCB cells among the PBS control, EA (30 µM), GCB (0.1 µM) and EA (30 µM) +GCB (0.1 µM) groups. (B) Quantitative bar chart of the cell cycle distribution among the treated groups. (C) Protein expression levels of procaspase 3 (C3) and cleaved caspase 3 (CC3) compared among the same groups. (D) Quantitative bar chart of C3 and CC3 expression among the treated groups. (E) Protein levels of γ-H2AX, a DNA double-strand breakage marker, compared among the same groups. (F) Results of the γ-H2AX foci assay compared among the same groups. (G) Results of the Matrigel-coated Transwell invasion assays compared among the same groups. (H) Quantitative bar chart of migrated cells among the treated groups. All statistical tests were analyzed with Student’s t test with significance at * < 0.05, ** < 0.01 (or ## < 0.001).

