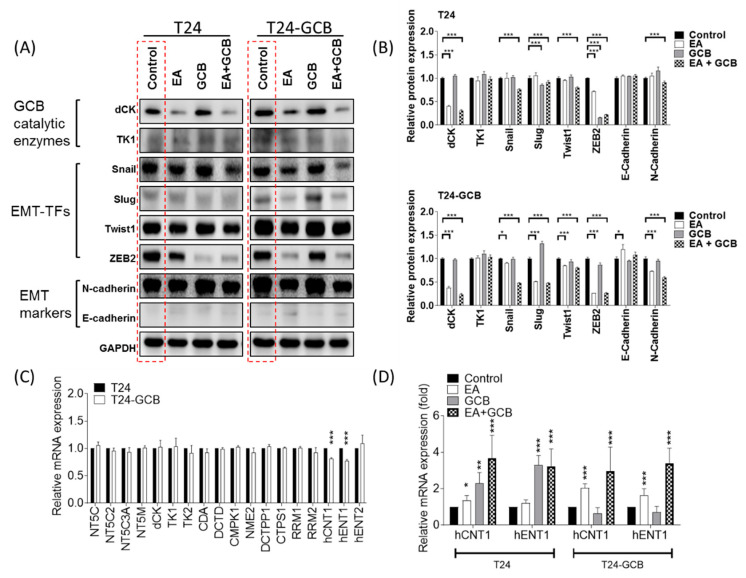
Figure 3.
(A) Protein expression levels of GCB catalytic enzymes (dCK and TK1), EMT-TFs (Snail, Slug, Twist1 and ZEB2) and EMT markers (N-cadherin and E-cadherin) in T24 and T24-GCB cells were compared among the PBS control, EA (30 µM), GCB (0.1 µM) and EA (30 µM) + GCB (0.1 µM) groups. (B) Quantitative bar chart of the protein expression of the indicated EMT-TFs among the treated groups. (C) Relative mRNA expression of 15 GCB metabolic enzyme genes and 3 transporter genes compared between T24 and T24-GCB cells. (D) Relative mRNA expression of hCNT1 and hENT1 compared among the PBS control, EA, GCB and EA+GCB groups between T24 and T24-GCB cells. All statistical tests were analyzed with Student’s t test with significance at * < 0.05, ** < 0.01 and *** < 0.001.

