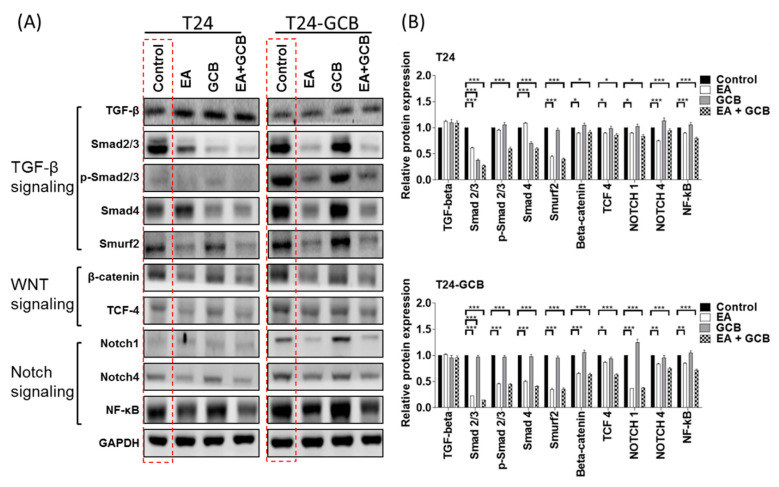
Figure 4.
(A) Protein expression levels of members of the TGF-β signaling pathway (TGF-β, Smad2/3, p-Smad2/3 and Smad4), WNT signaling pathway (β-catenin and TCF-4) and Notch signaling pathway (Notch1, Notch4 and NF-κB) were compared among the PBS control, EA (30 µM), GCB (0.1 µM) and EA (30 µM) + GCB (0.1 µM) groups between T24 and T24-GCB cells. (B) Quantitative bar chart of the protein expression of the indicated members among the treated groups. All statistical tests were analyzed with Student’s test with significance at * < 0.05, ** < 0.01 and *** < 0.001.

