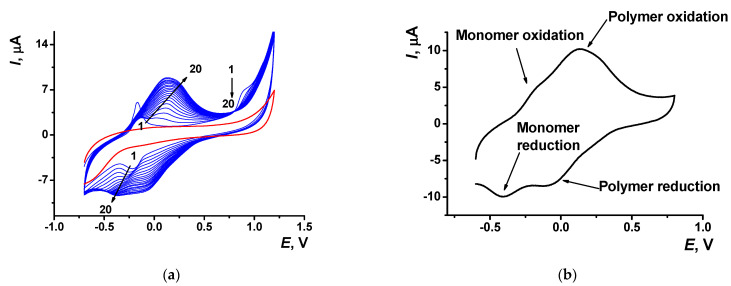
Figure 2.
(a) Multiple cyclic voltammograms recorded on the GCE in 0.1 M phosphate buffer containing 0.1 M NaNO3 and 0.2 mM Azure A, pH = 7.0; scan rate 100 mV/s. Red line corresponds to the bare GCE. Arrows indicate changes in the peaks from the 1st to 20th cycle. (b) Single cycle recorded on the GCE covered with poly(Azure A) transferred in the same buffer with no monomer dye.

