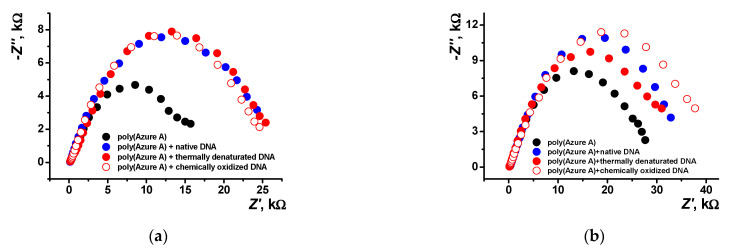
Figure 11.
Nyquist diagrams of the impedance spectra recorded on the GCE covered with poly(Azure A) with and without DNA addition for the film–solution interface: (a) electropolymerization from aqueous solution of 0.2 mM Azure A in 0.1 M phosphate buffer containing 0.1 M NaNO3 and 0.2 mg/mL DNA; (b) saturated with chloroform. Frequency range from 100 kHz to 0.04 Hz, amplitude of the applied sine potential 5 mV, pH = 7.0, and twenty cycles.

