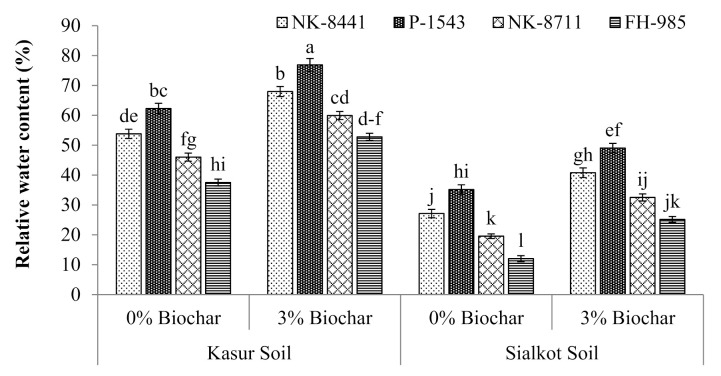
Figure 1.
Relative water content of studied maize cultivars with the application of biochar in the tannery polluted soils of Kasur and Sialkot. Mean values are indicated by the columns and the standard error of the mean is shown with bars. All means followed by different letters are significantly different (p < 0.05) according to Tukey’s HSD test.

