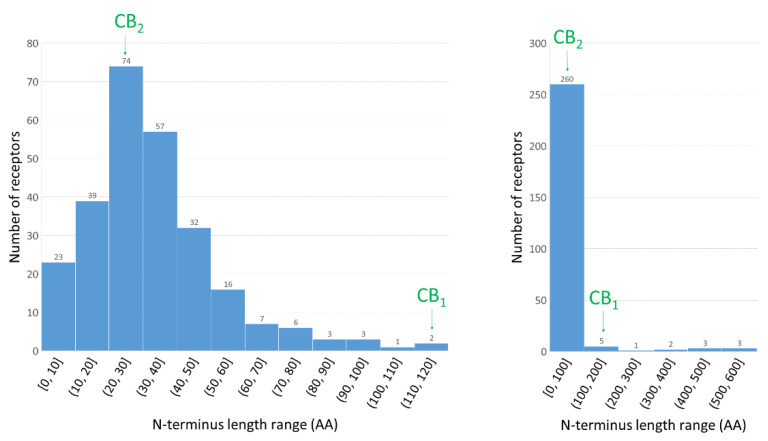
Figure 4.
Distribution of N-terminus lengths within class A of GPCRs. On left the histogram with 10 amino acid interval; on right the histogram for all class A GPCR, without odorant receptors, with 100 amino acid interval. Number of receptors in each range is specified above each bar. The ranges are given in parenthesis which are open from left side. Based on GPCRdb data [33].

