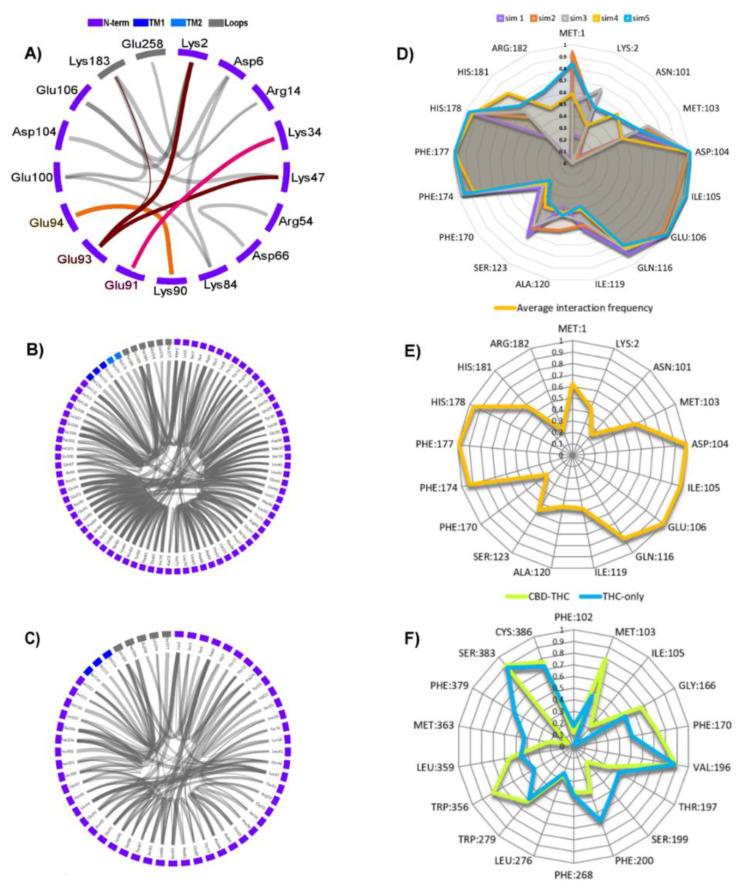
Figure 8.
(A–C) Flare plots of crucial interactions responsible for stabilizing the N-terminal domain in THC-only complex). Line thickness is proportional to the frequency of the interaction; (A) Ionic interactions; highlighted are the interactions of E91 (pink), E93 (dark red) and E94 (orange), (B) Total hydrogen bonds of N-terminus; (C) The hydrogen bonds of N-terminus excluding backbone-backbone H-bonds; (D,E) Ligand-receptor dynamic interaction fingerprints in THC-CBD complex; (D) frequency fingerprints of interactions of residues with CBD for each simulation separately; (E) the average interaction frequencies of fingerprints from panel D; (F) the average frequency fingerprints of interactions of residues with THC for simulations with THC-CBD (green) and with THC-only (blue) bound to the CB1R.

