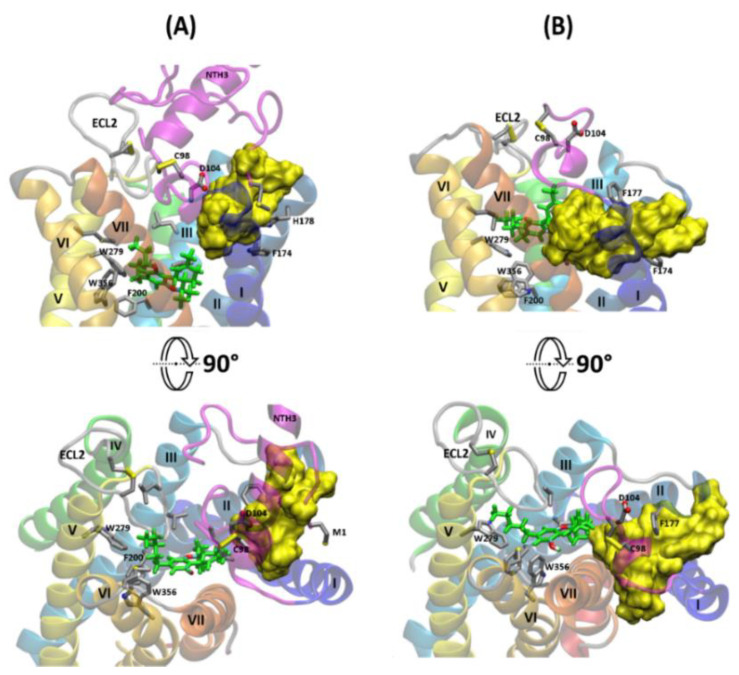
Figure 11.
Comparison of CBD binding modes (yellow surface for all poses) obtained after 1 µs of MD simulations for (A) WT CB1R (with whole N‑terminus), five CBD poses superimposed; and for (B) CB1R with truncated N-terminus—four CBD poses (two for Δ-88 and two for Δ-98 CB1R). All poses were superimposed using receptor structure as a reference. Orthosteric agonist, THC, is shown in green.

