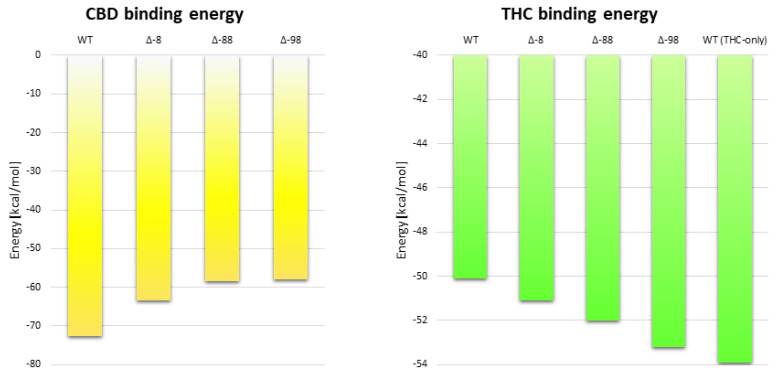
Figure 12.
Comparison of ligand binding energies for different mutants of CB1R with truncated N‑terminus and a wild-type receptor for CBD-THC complex. The energies of CBD binding to the allosteric site (left) are shown in yellow while the energies of THC binding to the orthosteric site (right) are shown in green. All reported binding energies are the average values obtained from several (5 for WT, and 2 for mutants) 1 µs long MD simulations and they were performed for CBD-THC complex (except for the last rectangle). Δ-8 (deletion of 1–8 residues), Δ-88 (deletion of 1–88 residues) and Δ-98 (deletion of 1–98 residues).

