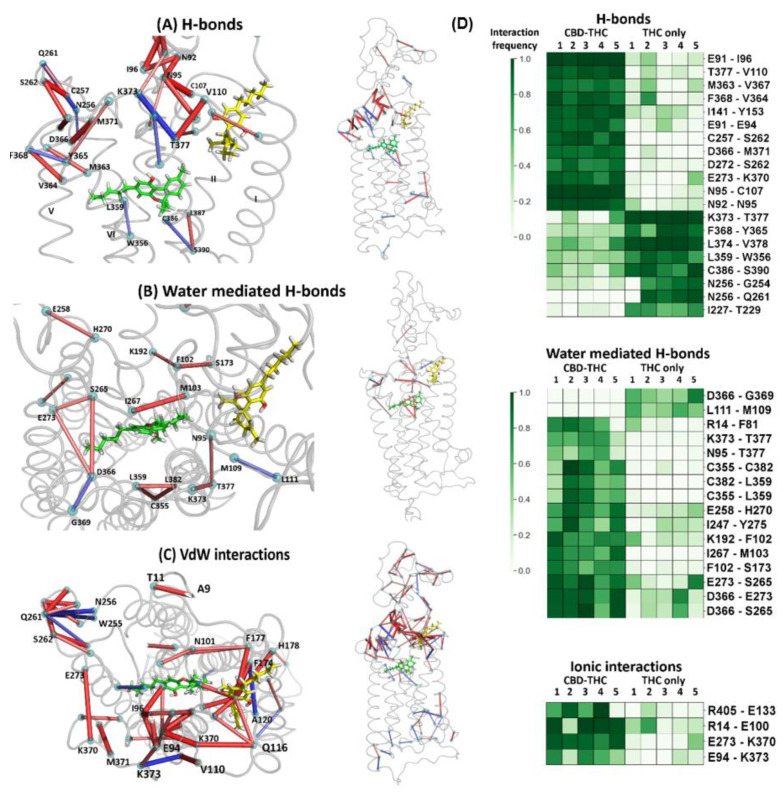
Figure 13.
Differences in contact frequencies between CBD-THC and THC-only complexes; (A) Hydrogen bonds—both side views; (B) Water mediated hydrogen bonds—the extracellular and side view; (C) van der Waals interactions—the extracellular and side view. Red sticks represent contacts occurring more frequently for CBD-THC simulations, and blue ones are the contacts occurring more frequently in THC-only simulations. The thickness of a stick as well as a color intensity correspond to the average frequency difference between those two populations of trajectories; (D) The interaction frequency fingerprints for CBD-THC and THC-only complexes (5 simulations for each complex). Presented interactions are very likely participating in the allosteric-orthosteric communication network since their frequencies differ significantly between simulations with and without an allosteric ligand (CBD). Among all possible interactions only the hydrogen bonds, water mediated hydrogen bonds, and ionic interactions are shown.

