Figure 1.
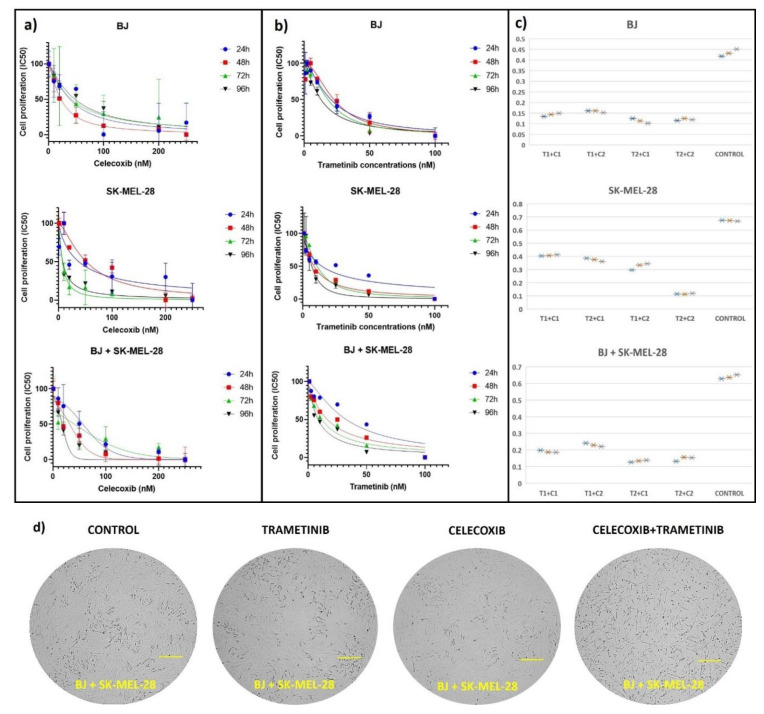
Cell proliferation testing after exposure to celecoxib and trametinib. Each cell line, SK-MEL-28 and BJ cell cultures, as well as the co-cultured cells were exposed to different concentrations of celecoxib (for 24, 48, 72, 96 h) (a), trametinib (for 24, 48, 72, 96 h) (b) and to the celecoxib (C1 = 20 nM and C2 = 50 nM) and trametinib (T1 = 25 nM and T2 = 50 nM) drug combination for 72 h (c). Both (a,b) IC50 graphs were generated using GraphPad Software, nonlinear regression (curve fit) and illustrate mean values ± standard error of the mean (SEM), n = 3 for each sample. The third panel from both (a,b) graphs illustrates cell viability results after treating co-culture cells with celecoxib or trametinib separately. The suitable drug combination was chosen after analyzing cell viability after 72 h exposure to four different drug combinations via Excel–Box and Whisker. Each drug combination was testes in triplicate and was illustrated as asterix (*) after Tecan reading (c). Cell viability of the BJ + SK-MEL-28 co-culture diminished with increasing concentrations of celecoxib and trametinib, in a dose and time dependent manner. At the end of the protocol, following different exposure regiments, cells were observed in each group as shown in (d).

