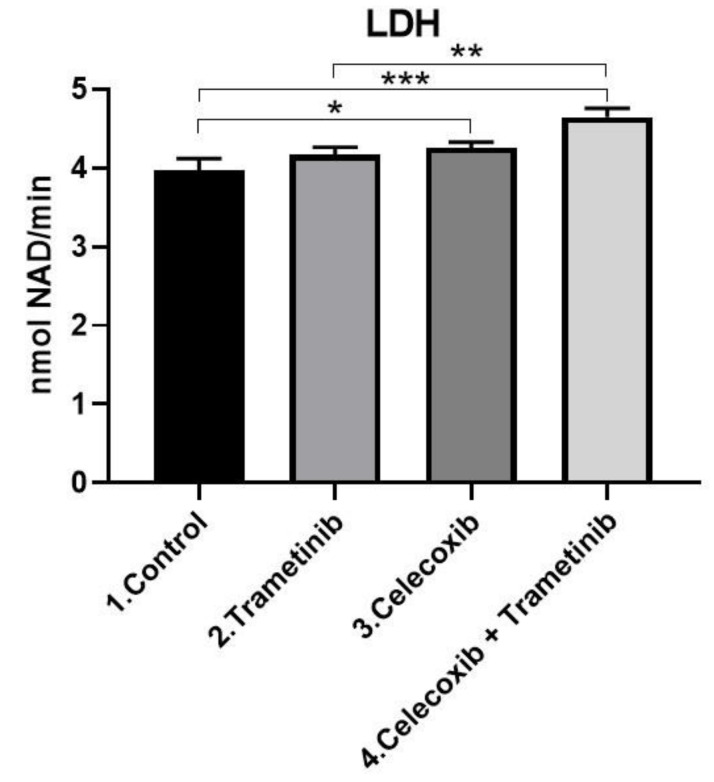
Figure 2.
Cell membrane damage. Comparative analysis following T + C exposure compared with the control showed greater cytosolic LDH enzyme release in the last group (p < 0.001). LDH levels were even significantly higher than the group treated with celecoxib (p < 0.01). Quantitative results were expressed in nmol NAD+/min. * p < 0.05, *** p < 0.001 vs. control, untreated cells; ** p < 0.01 vs. trametinib. Each bar represents mean ± standard deviation (n = 3).

