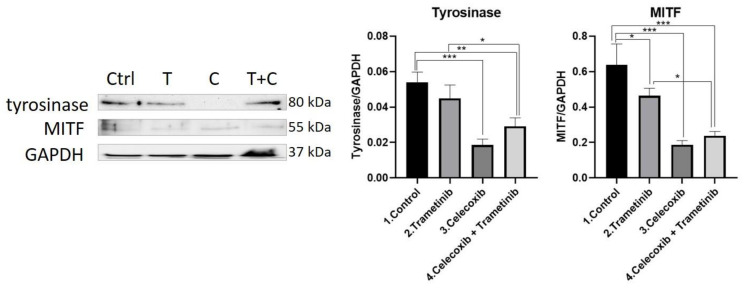
Figure 7.
Western blot analysis of tyrosinase and MITF. Protein expression of tyrosinase and MITF in the 2D melanoma model. WB bands were analyzed by densitometry and results were normalized to GAPDH. The left panel illustrates WB bands (Ctrl = control, T = trametinib, C = celecoxib, T + C = trametinib + celecoxib), while right panels illustrate the quantitative analysis of WB results (1 = control, 2 = trametinib, 3 = celecoxib, 4 = celecoxib + trametinib). * p < 0.05, ** p < 0.01, *** p < 0.001. Each bar represents mean ± standard deviation (n = 3).

