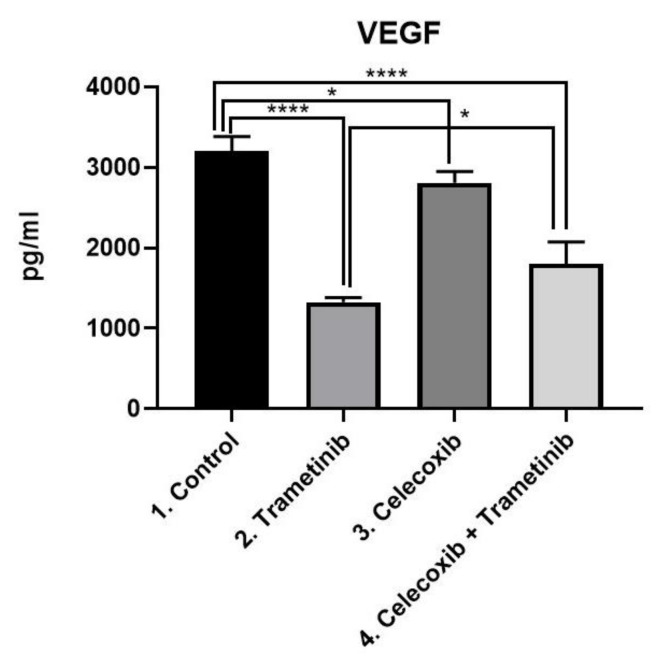
Figure 10.
ELISA analysis of VEGF. Protein expression of VEGF (pg/mL) in SK-MEL-28 + BJ co-culture cells treated with T + C therapeutic combination for 72 h. * p < 0.05, **** p < 0.0001 vs. control, untreated cells and * p < 0.05 vs. trametinib group. Each bar represents mean ± standard deviation (n = 3).

