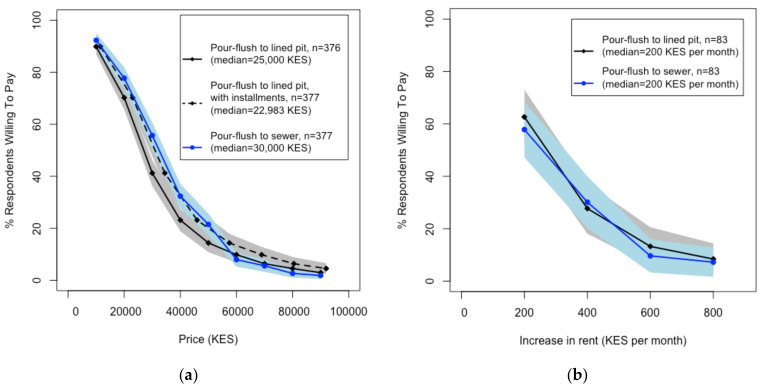
Figure 2.
Demand curves for high-quality, pour-flush latrine options derived from survey-based stated WTP information. (a) Stated WTP levels among landowners and homeowners at different price points for the two high-quality latrine options. (b) Stated WTP levels for rent increases among tenants to support the provision of high-quality latrine options. Both groups provided WTP for pour-flush latrines connected to lined pits (black) and pour-flush latrines connected to the sewer (blue); the shaded areas represent 95% confidence intervals. In (a), the solid lines represent the stated WPT in the scenario of one-time payments; the dashed line represents the stated WTP in the scenario of 12 monthly installments.

