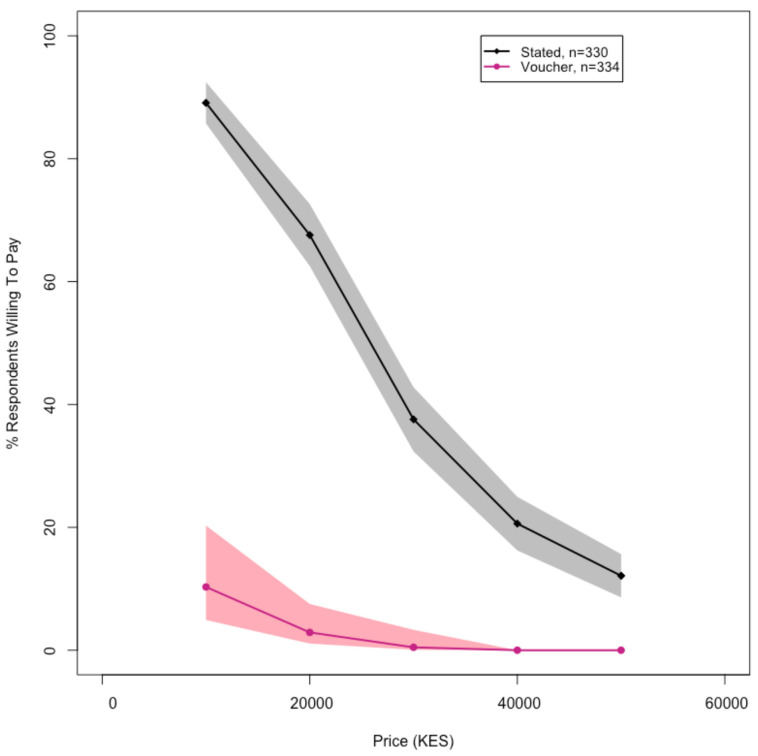
Figure 3.
A comparison of stated (black) and revealed (pink) WTP among landowners/homeowners for high-quality, pour-flush latrines connected to a lined waste containment pit. The shaded areas represent 95% confidence intervals. For the stated WTP, the data are only from households that were eligible to receive vouchers. Of the 334 households that were eligible to receive vouchers, we have stated WTP data for 330, since four households answered “don’t know” to the stated WTP question.

