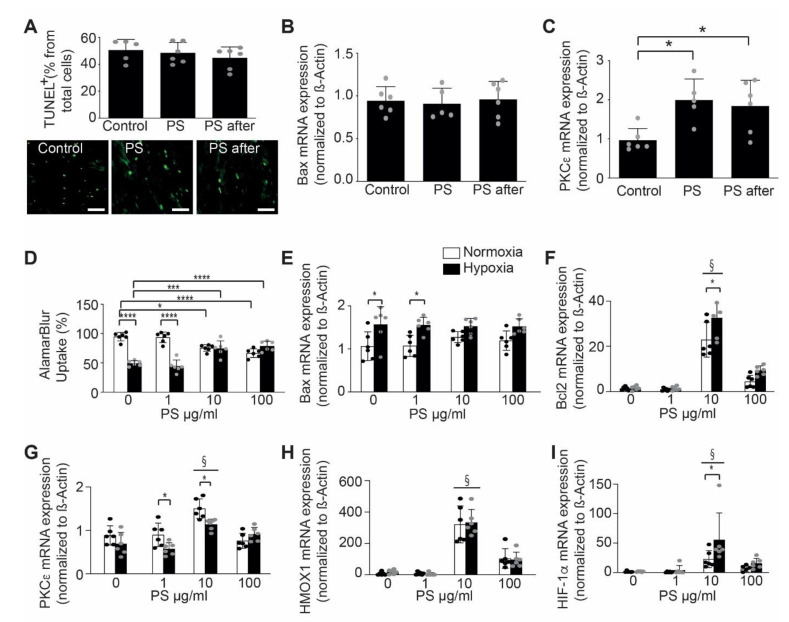
Figure 2.
Phosphatidylserine oral supplementation effects on cardio-protection. (A) There was no difference in apoptotic cell death between the two groups measured by TUNEL staining of myocardial infarction in mice, untreated (Control), treated with phosphatidylserine before and after AMI (PS) or phosphatidylserine only after AMI (PS after, n = 5–6/group, One-way ANOVA, Tukey’s multiple comparison Test, * p < 0.05, Values ± SD). Lower panel shows representative images of tunnel staining. (B) There was no difference in Bax mRNA expression in AMI of mice, following PS treatment when comparted to control (n = 5–6/group, One-way ANOVA, Tukey’s multiple comparison Test, Values ± SD). (C) Phosphatidylserine treatment prior and post-AMI increased PKC-ε mRNA expression in AMI of mice when compared to control (n = 5–6/group, One-way ANOVA, Tukey’s multiple comparison Test, * p < 0.05, Values ± SD). (D) Phosphatidylserine treatment improved cell viability assessed by AlamurBlue stain following hypoxic conditions in neonatal murine cardiomyocytes when compared to control (normoxic conditions) in a dose-dependent manner (n = 6, Two-way ANOVA, Bonferroni’s multiple comparison Test, * p < 0.05, *** p < 0.001, **** p < 0.0001, Values ± SD) (normoxia-white bars, hypoxia-black bars). (E) Phosphatidylserine treatment protected the cardiomyocytes against apoptosis, as shown by unchanged Bax mRNA expression in treated neonatal cardiomyocytes when submitted to hypoxia (n = 6, Two-way ANOVA, Bonferroni’s multiple comparison Test, * p < 0.05, Values ± SD) (normoxia-white bars, hypoxia-black bars). (F) Phosphatidylserine treatment increased Bcl2 mRNA expression in neonatal cardiomyocytes treated, when compared to control (n = 6, Two-way ANOVA, Bonferroni’s multiple comparison Test, * p < 0.05, § < 0.05 vs. Control, Values ± SD) (normoxia-white bars, hypoxia-black bars). (G) Phosphatidylserine treatment increased PKCε mRNA expression in neonatal cardiomyocytes when compared to control (n = 6, Two-way ANOVA, Bonferroni’s multiple comparison Test, * p < 0.05, § < 0.05 vs. Control, Values ± SD) (normoxia-white bars, hypoxia-black bars). (H) Phosphatidylserine treatment increased HMOX1 mRNA expression in neonatal cardiomyocytes when compared to control (n = 6, Two-way ANOVA, Bonferroni’s multiple comparison Test, § < 0.05 vs. Control, Values ± SD) (normoxia-white bars, hypoxia-black bars). (I) Phosphatidylserine treatment increased HIF-1α mRNA expression of neonatal cardiomyocytes, when compared to control (n = 6, Two-way ANOVA, Bonferroni’s multiple comparison Test, * p < 0.05, § < 0.05 vs. Control, Values ± SD) (normoxia-white bars, hypoxia-black bars).

