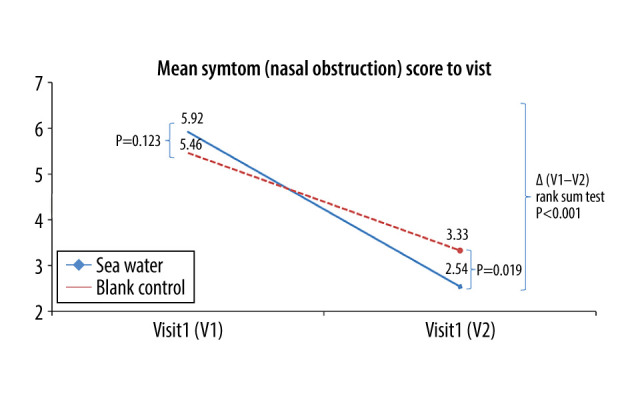
Figure 4.

Mean symptom (nasal obstruction) scores before and after treatment. * Comparison between mean symptom scores by paired t test for independent samples; ** Mean score variations between the 2 groups (V1–V2) assessed by the rank-sum test.

Mean symptom (nasal obstruction) scores before and after treatment. * Comparison between mean symptom scores by paired t test for independent samples; ** Mean score variations between the 2 groups (V1–V2) assessed by the rank-sum test.