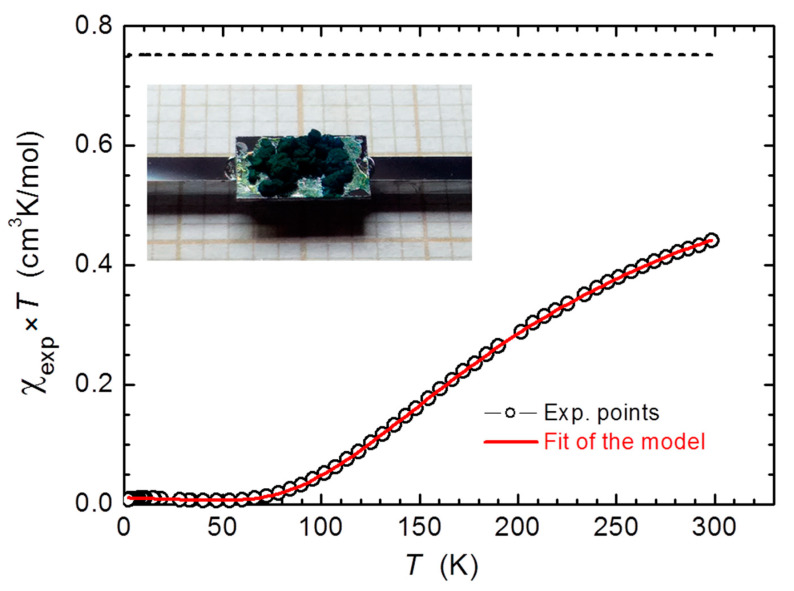
Figure 8.
Experimental magnetic susceptibility χexp × T of [Cu2(tig)4(tigH)2] plot vs. temperature T. Experimental points are marked by black circles and the results of the modelling including T-dependent response of a Cu(II)–Cu(II) dimer (mid-to-high T range), a Curie paramagnetic-like contribution (very low temperatures) and T-independent diamagnetism of the host are depicted as the red solid line. The black dashed line denotes the Curie constant calculated for two noninteracting S = ½ spins. The inset: [Cu2(tig)4(tigH)2] powder specimen attached to the rectangular Si support plate and mounted onto a Si holder.

