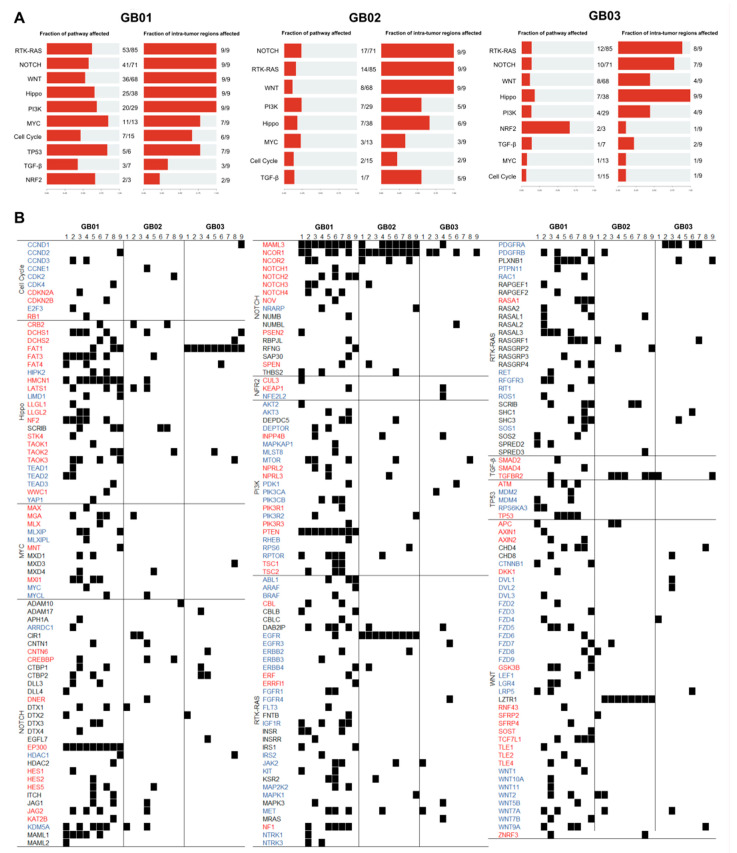
Figure 5.
Oncogenic pathways. (A) Pathway alteration frequencies. Fraction of mutated genes for each pathway and fraction of tumor regions with mutated genes for that pathway. (B) Detail of mutated genes in their respective altered pathways for each of the 27 tumor regions. Black square indicates the presence of a rare mutation. Tumor-suppressor genes are in red and oncogenes are in blue.

