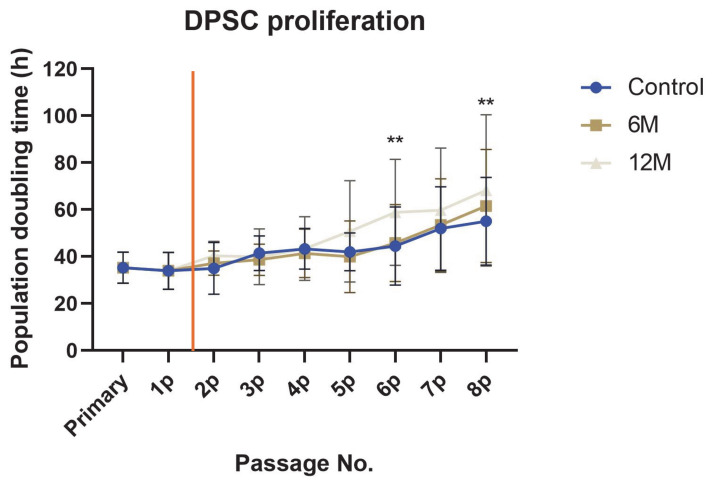
Figure 5.
The population doubling time of all cell groups reached from the primary to 8th passage. Data for primary and 1st passage are the same for all cell groups. The red vertical line illustrates the time of cryopreservation and thawing. Data are presented as a mean and SD plotted as error bars. The statistical significances were calculated between fresh samples and cryopreserved samples using either one-way ANOVA, followed by Dunnett’s multiple comparison test for continuous variables, or Friedman’s test, followed by the Dunn’s multiple comparison test on ranks for nonparametric variables (** p < 0.01).

