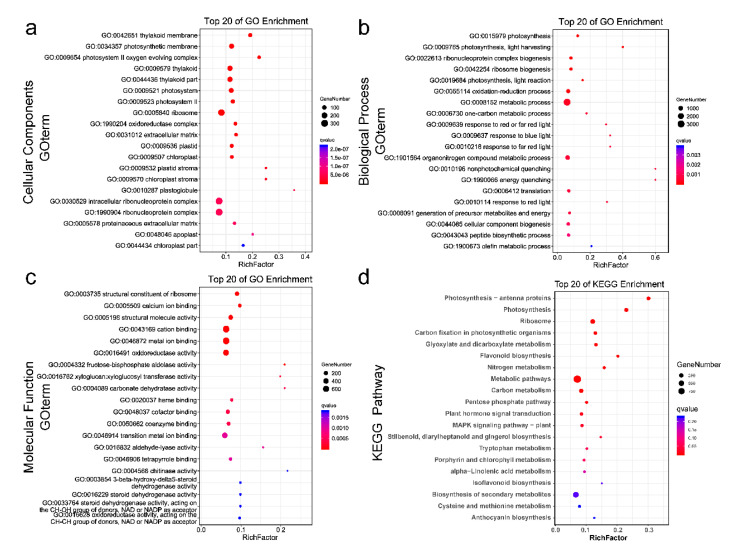
Figure 4.
GO annotation and KEGG pathway analysis. (a–c) Top 20 GO enrichment classifications of DEGs in (a) cellular components, (b) biological process, and (c) molecular function; (d) top 20 KEGG enrichment pathways of DEGs. The y-axis represents the top enriched GO or KEGG pathways’ terms. The size and color of circles indicate the number of genes and Q-values of the enriched term, respectively. The x-axis represents the rich factor (RF), which refers to the ratio between the number of DEGs and the number of genes annotated in a given term or pathway. A large RF indicates a high degree of enrichment.

