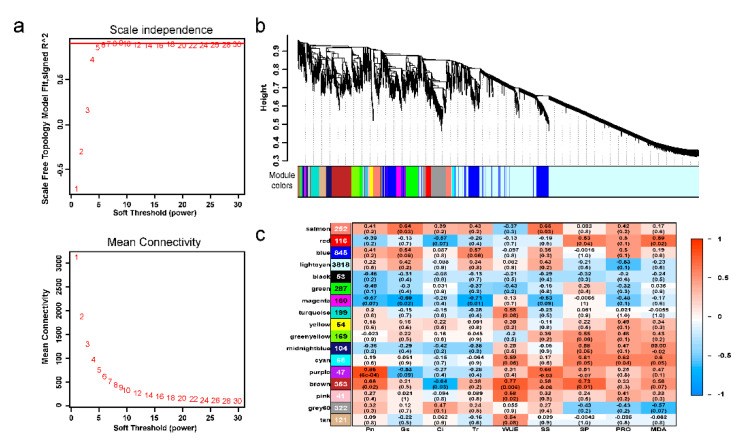
Figure 5.
Construction of the WGCNA model. (a) Screening of soft threshold powers by network topology analysis. (b) Coexpression modules identified by WGCNA. The major tree branches represent 17 modules. (c) Module–trait correlation relationships. The number in the first row of each cell represents the corresponding correlation, and the number in parentheses represents the p-value. The color of each cell represents the correlation coefficient. The numbers in the leftmost modules represent the numbers of DEGs in this module.

