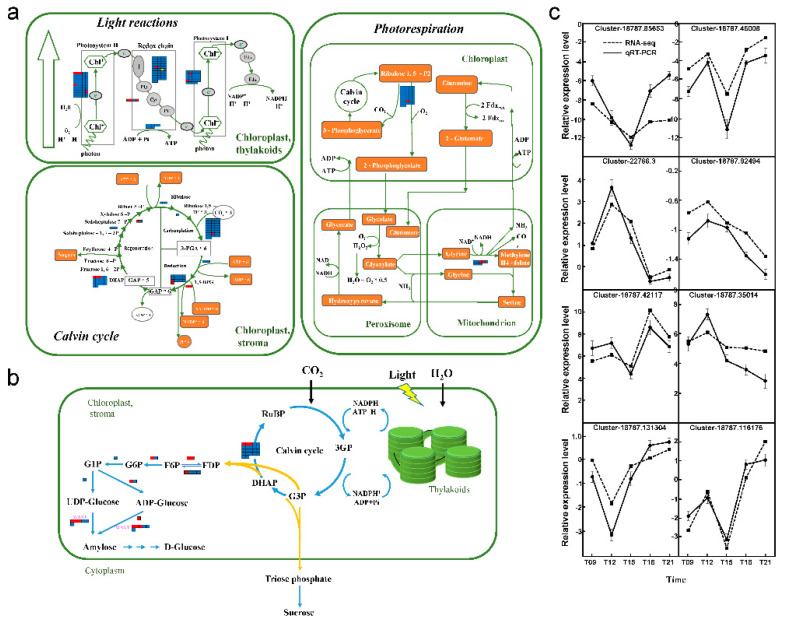
Figure 6.
DEGs are involved in photosynthesis, carbon fixation, and starch biosynthesis. (a) Photosynthesis and carbon fixation pathway; (b) Starch biosynthesis pathway. The color of the rectangle represents the changes of gene expression under NaCl treatment, red indicates upregulated and blue indicates downregulated over the full-time series (09:00–21:00). The yellow represents DEGs with both differentially upregulated and downregulated expressions over the time series. FDP: beta-D-fructose 1, 6-bisphosphate, F6P: beta-D-fructose 6-phosphate, G6P: alpha-D-glucose 6-phosphate, G1P: D-glucose 1-phosphate. The details of gene annotation and expression changes are shown in Tables S13 and S14, respectively. (c) Verification and expression analysis of selected DEGs by quantitative real-time PCR (qRT-PCR). Data are presented as means ± SD (n = 3).

