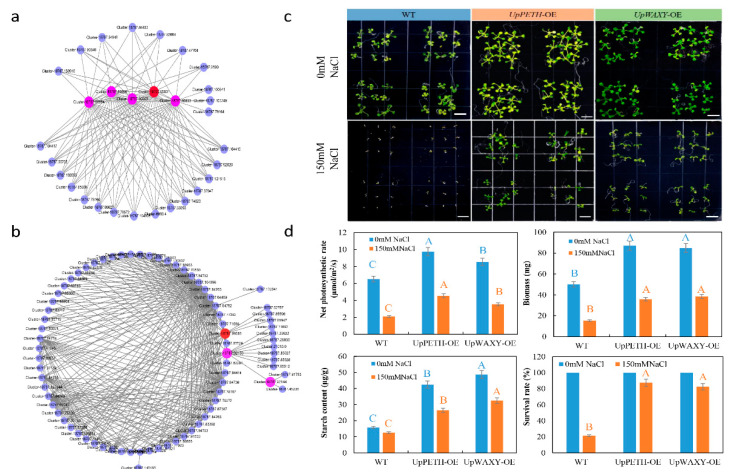
Figure 7.
Potential regulatory networks with hub genes in target modules. (a,b) Gene regulatory network with potential interactions with (a) UpPETH (Cluster-18787.85831), and (b) UpWAXY (Cluster-18787.99586), respectively. Red nodes represent hub genes (UpPETH or UpWAXY), pink nodes represent genes homologous with the hub gene, and blue nodes represent genes with potential interactions with the hub gene. Details of gene annotation are provided in Tables S15 and S16. (c) Phenotypes of transgenic and WT Arabidopsis lines with UpPETH and UpWAXY overexpression after 7 days of growth under 0 mM and 150 mM NaCl treatments; (d) Pn, biomass, starch content, and survival rates of transgenic plants after 45 days of growth under 0 mM and 150 mM NaCl treatments. Values represent means ± SD (n = 3). Bars with blue uppercase letters indicate statistical significance at p <0.01 under the 0 mM treatment. Bars with orange uppercase letters indicate statistical significance at p < 0.01 under the 150 mM treatment.

