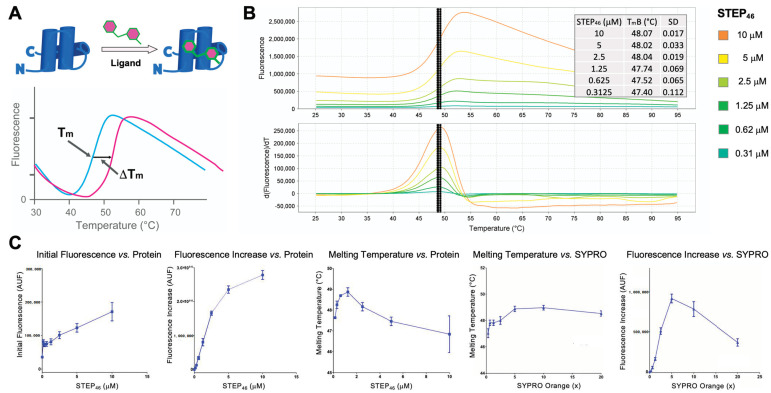
Figure 4.
(A) Protein thermal shift (PTS) assay principle. Globular protein can be stabilized or destabilized by small-molecule binding, resulting in a change in the protein melting temperature (Tm). (B) STEP46 titration in the PTS assay. Melt curves (top) and first derivative plots (bottom) are shown for various concentrations of STEP46. Data were recorded using a ViiA 7 thermocycler and analyzed using Protein Thermal Shift software. The STEP46 melting profiles demonstrate a single inflection point and a single peak in the first derivative plot, with narrow error margins for the derivative melting temperature. The inset table lists the Boltzmann melting temperature (TmB) and standard deviation (SD) for each STEP46 concentration tested. (C) STEP46 PTS assay optimization. The initial fluorescence (Fi) and fluorescence signal increase (∆FI) for various STEP46 concentrations are shown in the two panels on the left. The middle panel shows the measured STEP46 TmB at various STEP46 concentrations. The two panels on the right exhibit the STEP46 TmB as well as ∆FI at various SYPRO Orange concentrations.

