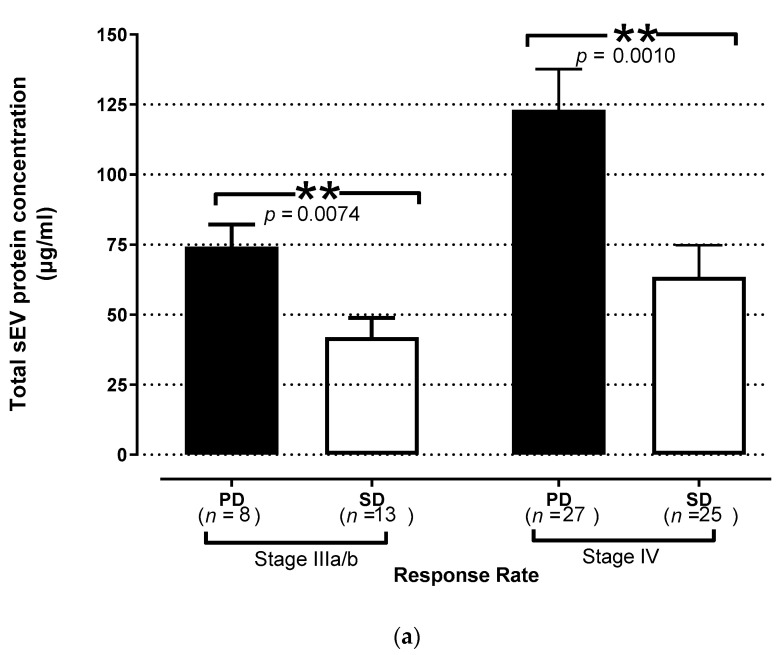
Figure 3.
Prognostic significance of sEV in chemotherapy-naïve NSCLC patients. (a) Response to treatment in patients according to TEP levels at baseline. The levels were increased in patients with disease progression (PD, closed bars) compared with patients controlling their disease (open bars) after 3 cycles of therapy. The bars denote mean values ± SEM. Kaplan–Meier plots of (b) PFS and (c) OS in patients according to high and low TEP levels in plasma. The high TEP levels were correlated with worse PFS (p < 0.0001) and OS (p < 0.0001); blue line: below the median, green line: above the median (n: number of patients; PR: partial response; SD: stable disease; PD: progressive disease; PFS; progression-free survival; OS: overall survival; NSCLC: non-small-cell lung cancer; **, p < 0.01).


