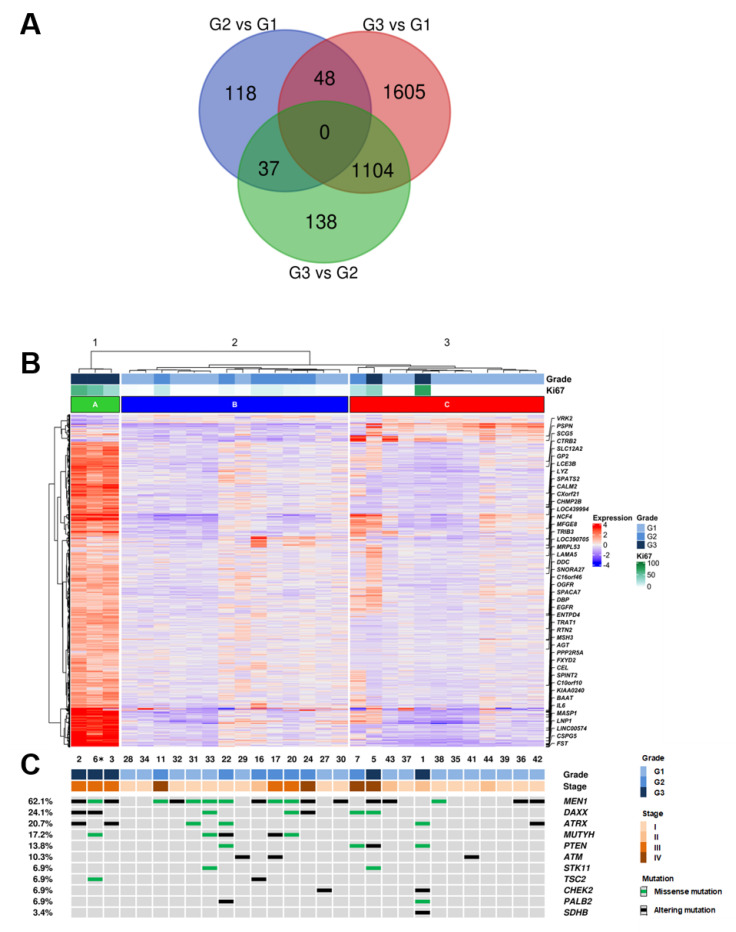
Figure 1.
Integrated RNA and DNA sequencing of 29 PanNET samples (28 primary and one metachronous G3 recurrency *) grouped by histological grade. (A) Overlap of differentially expressed genes in G3 vs. G2, G3 vs. G1 and G2 vs. G1 PanNETs. (B) Hierarchical clustering of RNA gene expression and Deseq2 approach defined 3050 genes as significantly differentially expressed between histological grades. (C) List of 11 genes that were altered at sequencing analysis; the legend for alteration type is reported in the panel on the right. * (Patient ID #6, Supplementary Table S1).

