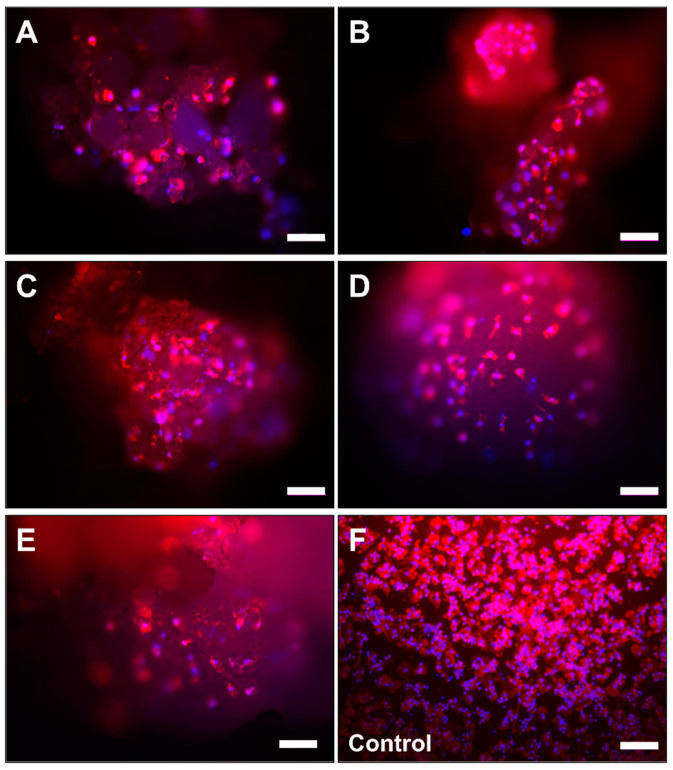
Figure 3.
Microscopic images of the primary monocytes/macrophages on the surfaces of the five bone substitute materials (A: Cerasorb 50–150 µm, B: Cerasorb 63–250 µm, C: Cerasorb M 150–500 µm, D: Cerasorb M 500–1000 µm, E: Cerasorb 500–1000 µm) and of the control group (F) at day 7 (Phalloidin-DAPI-immunofluorescent stainings, 100× magnifications, scalebars = 100 µm).

