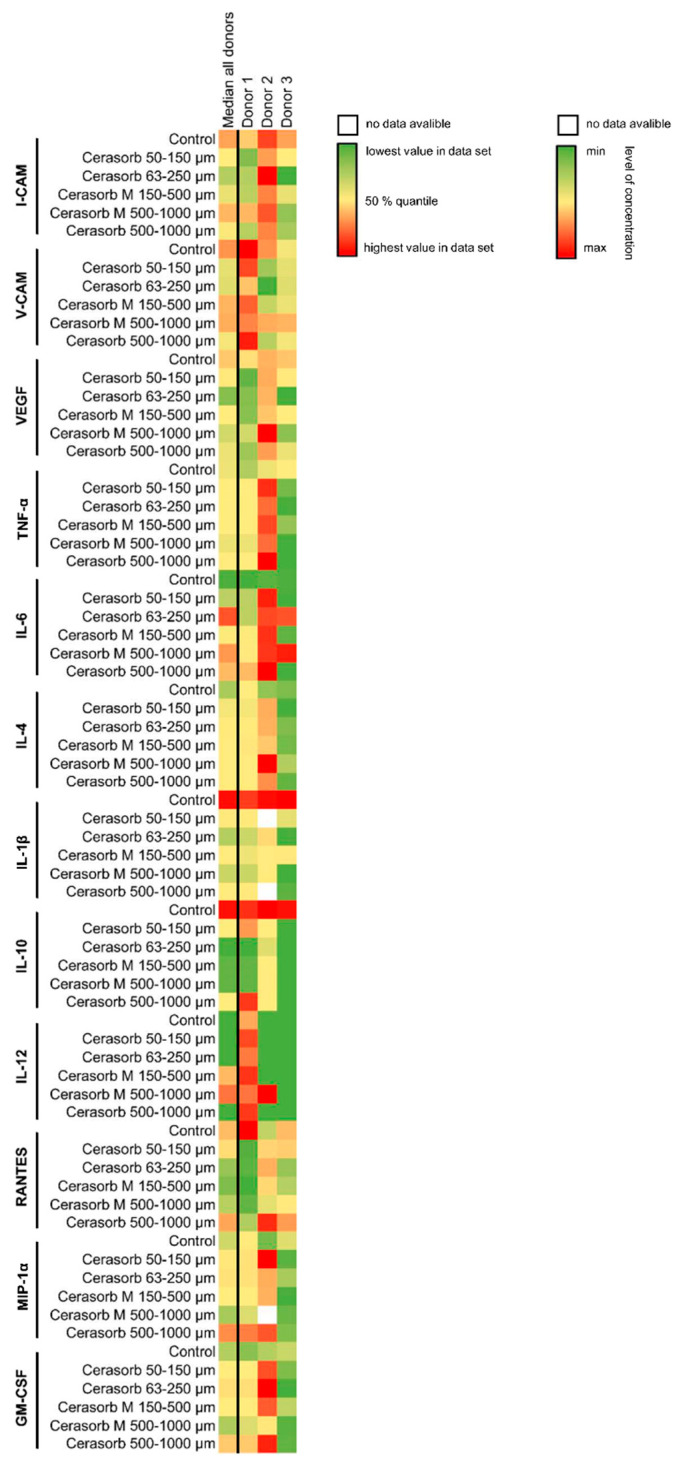
Figure 4.
Heat Map of cytokines expressed by the monocytes. The median cytokine concentrations of each donor and the overall median are displayed for each analyzed cytokine. A green stain shows the lowest concentration, a yellow stain the 50% quantile and the red stain the highest concentration of each analyzed cytokine. A white square is shown, if the measured concentration was out of range during the measurement.

