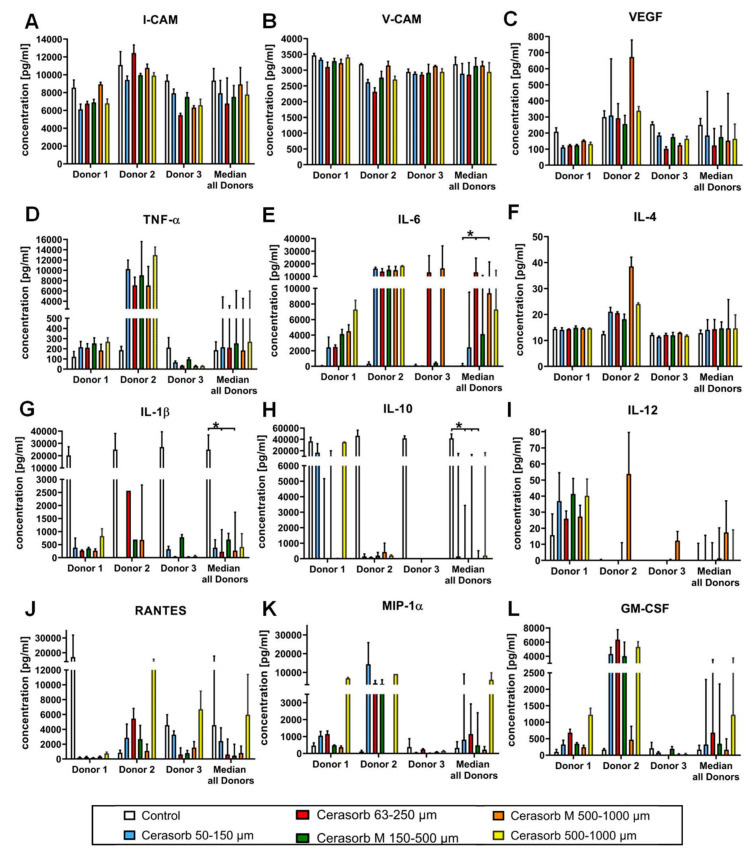
Figure 5.
Cytokine concentrations after monocyte cell growth. The graphs display the median concentrations of analyzed cytokines (A) I-CAM, (B) V-CAM, (C) VEGF, (D), TNF-α, (E) IL-6, (F) IL-4, (G) IL-1β, (H) IL-10, (I) IL-12, (J) RANTES, (K) MIP-1αand (L) GM-CSF in the individual donors and the overall median of all donors. Data are shown as medians ± SD. Significant differences are marked with a star.

