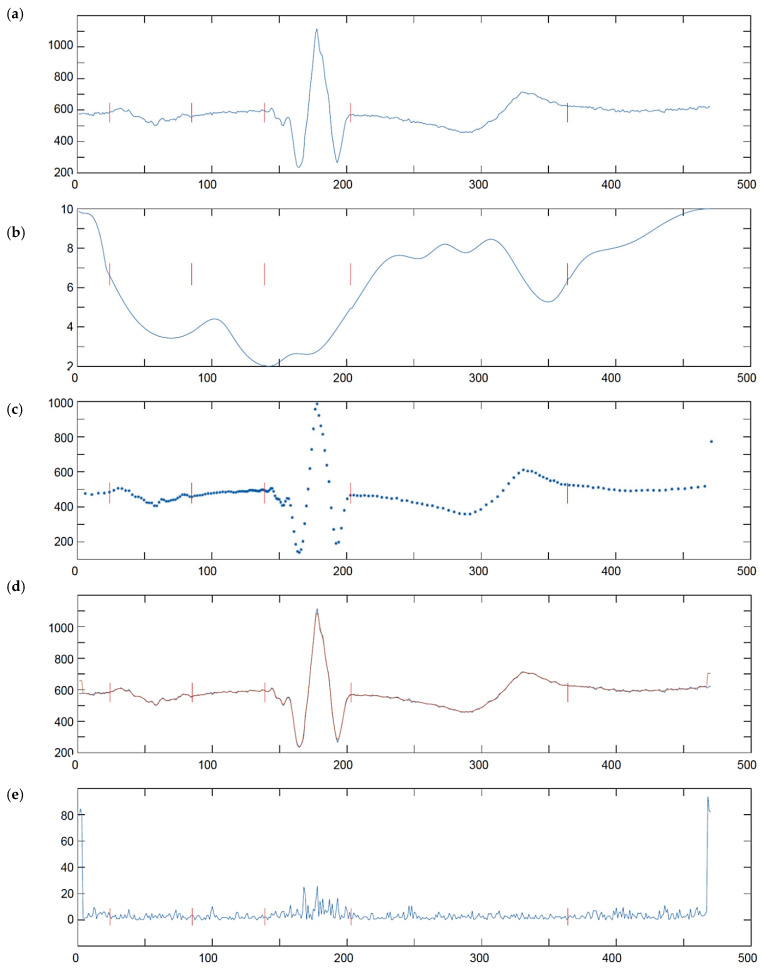
Figure 8.
CSE test file MA1_001, lead I (a) oECG, (b) sampling interval [ms], (c) nECG, (dot-plotted to highlight non-uniform sampling), (d) uECG (orange) vs. oECG (blue), (e) absolute uniformization error (|oECG-uECG|); all horizontal axes in sample numbers (a 2 ms unit); vertical red lines are P, QRS and T-waves delimitation points; errors at both ends of nECG and uECG are caused by adaptive anti-aliasing filter.

