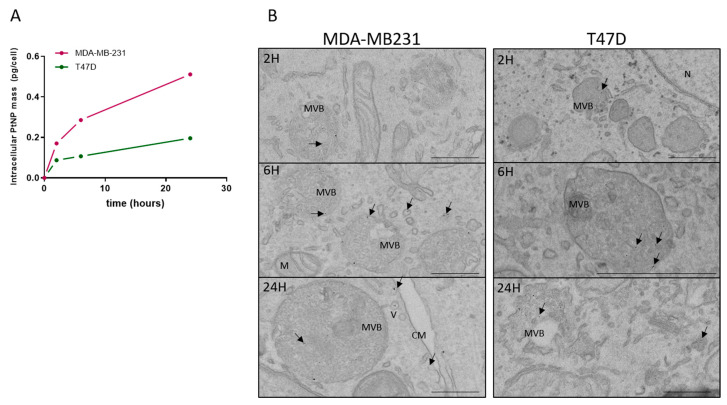
Figure 1.
Assessment of the nanoparticle uptake in the MDA-MB-231 and T47D cells. (A) Absolute quantification of the intracellular mass of platinum nanoparticles per cell, following an exposure of 2, 6, or 24 h and measured by ICP–MS. (B) Representative images obtained by using Transmission Electron Microscopy of the MDA-MB-231 (left) and T47D (right) cells, after being exposed for 2, 6, or 24 h to 0.5 mM PtNPs. Nanoparticles are indicated by arrows. M = mitochondria, MVB = multivesicular body, V = vesicle, CM = cell membrane, N= nucleus. Scale bar = 500 nm.

