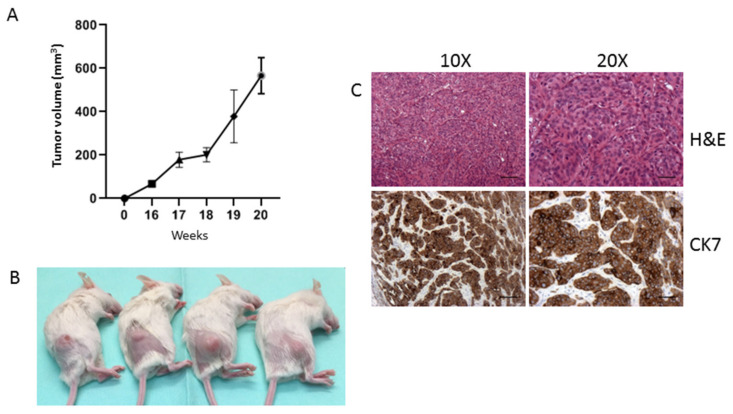
Figure 7.
Tumor formation in NOD/SCID mice inoculated with 82.3 cells. In vivo tumor growth curve of 82.3 cells (A). Representative images of tumors derived from the injection of 5 × 10⁶ of 82.3 cells (B). Representative histochemistry and immunohistochemistry images for the CK7 expression of explanted tumors acquired at 10× and 20× magnification. Scale bar: 100 µm (C).

