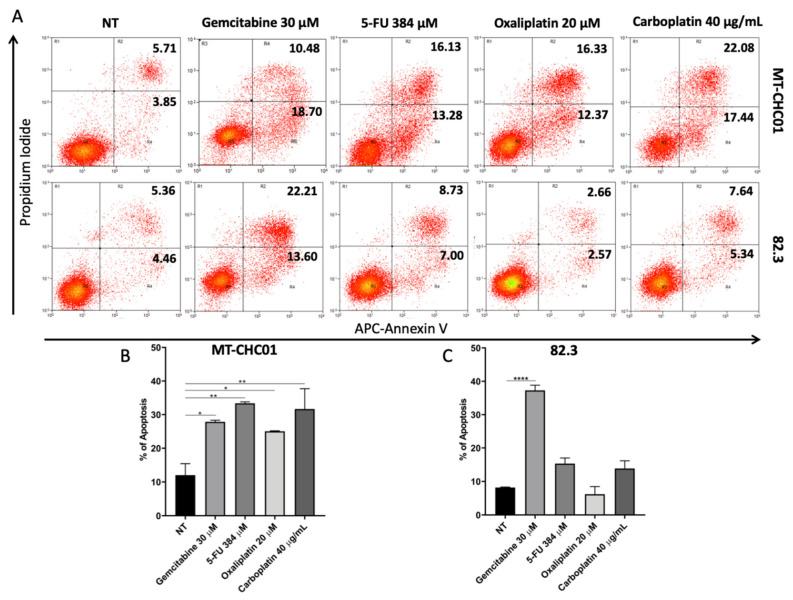
Figure 10.
Evaluation of apoptosis after drug treatment in 82.3 and MT-CHC01 cells by Annexin V/Propidium Iodide assay. Cells were treated with the indicated doses of the drugs, and apoptosis was evaluated after 72 h. Flow charts report the percentage of early and late apoptosis (A). Graphs represent the percentage of all apoptotic events in MT-CHC01 (B) and 82.3 (C) cells. NT: not treated. * p < 0.01, ** p < 0.001 and **** p < 0.00001.

