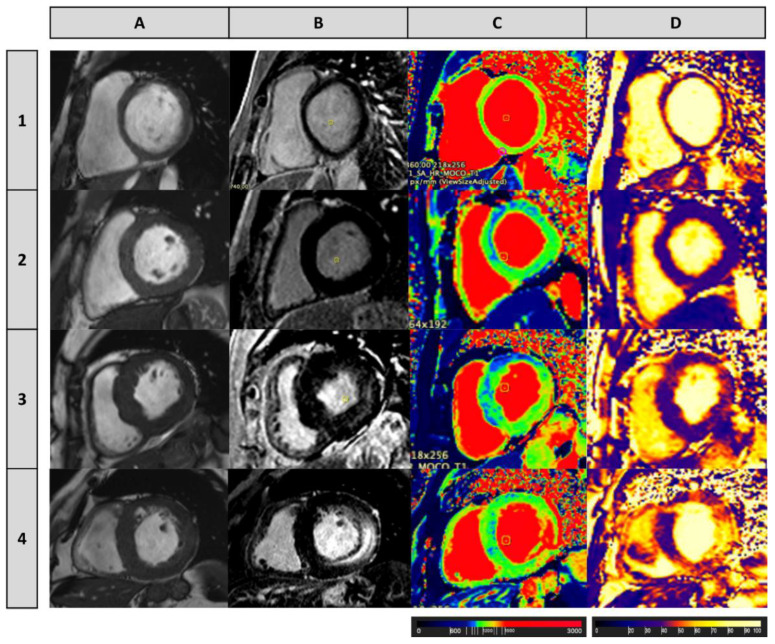
Figure 2.
Cardiac magnetic resonance imaging (MRI) (3.0 Tesla) in four Fabry patients, illustrating different stages of myocardial involvement by the disease. (A) Cine (balanced steady-state free precession sequence) image at the basal left ventricular (LV) short-axis slice; (B) Late gadolinium enhancement (LGE) at the basal LV short-axis slice; (C) Native T1 mapping (precontrast) performed using a modified Look-Locker inversion (MOLLI) recovery sequence at the basal LV short-axis slice (the resulting pixel-by-pixel T1 color maps were displayed using a customized lookup table, in which normal myocardium was green, increasing T1 was yellow and red, and decreasing T1 was blue); and (D) T2 mapping (fast low angle shot (FLASH)) at basal LV short-axis slice (the resulting pixel-by-pixel T2 color maps were displayed using a customized lookup table, in which normal myocardium was purple and increasing T2 was red and yellow). Patient 1: A 26-year-old female without LVH or LGE, presenting normal values of T1 (1265 ± 68 ms at the basal septum) and T2 (41.76 ± 5.40 ms at the basal septum); Patient 2: A 41-year-old male without LVH or LGE, presenting low T1 (1118 ± 40 ms) and normal T2 (40.93 ± 5.80 ms) values at the basal septum; Patient 3: A 76-year-old female with LVH (LV mass 83 g/m2, maximum wall thickness 19 mm at the basal septum) and diffuse LGE in the basal segment of the inferolateral wall, who presents low T1 (1093 ± 36 ms) at the basal septum and T1 pseudonormalization particularly at the inferolateral wall (1276 ± 59 ms), where a mild increase in T2 values (49.10 ± 2.30 ms) was also observed; Patient 4: A 69-year-old male patient with LVH (LV mass 123 g/m2, maximum wall thickness 18 mm at the septum) and diffuse and extensive LGE in the inferolateral wall, who presents areas of T1 pseudonormalization but also areas of T1 increase, such as in the inferolateral wall (1425 ± 144 ms), where T2 values (64.44 ± 8.56 ms) are also increased.

