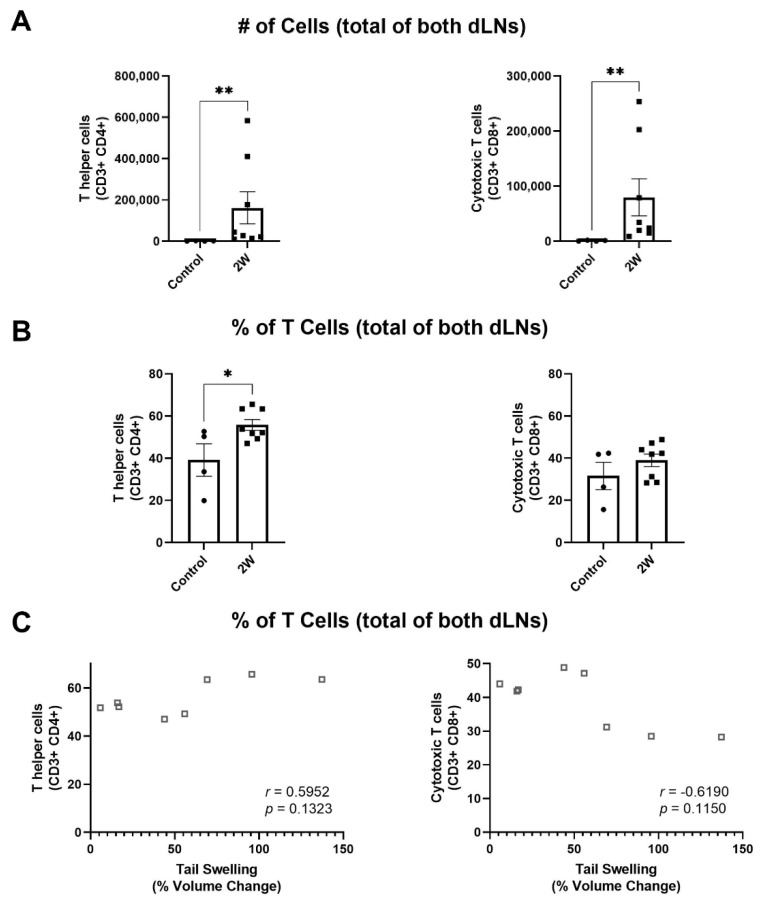
Figure 2.
T helper cells increase as a percentage of T cells in dLNs during lymphedema development while cytotoxic T cells do not. (A) Number of T helper cells and cytotoxic T cells in dLNs for an unoperated control and after single vessel ligation lymphedema surgery at 2W timepoint. Represented as the sum of the two dLNs. Mann–Whitney tests were used for comparison between groups. (B) T helper cell and cytotoxic T cell percentages of T cells within dLNs for an unoperated control and after single vessel ligation lymphedema surgery at 2W timepoint. Represented as the sum of the two dLNs for T cell subtype divided by the sum of total T cells within the two dLNs. Unpaired T tests were used for comparison between groups. Control (n = 4), 2W (n = 8). Mean ± s.e.m. * (p < 0.05), ** (p < 0.01). (C) Spearman’s rank correlation between percent of T cells and percent volume change following single vessel ligation lymphedema surgery for T helper cells and cytotoxic T cells.

