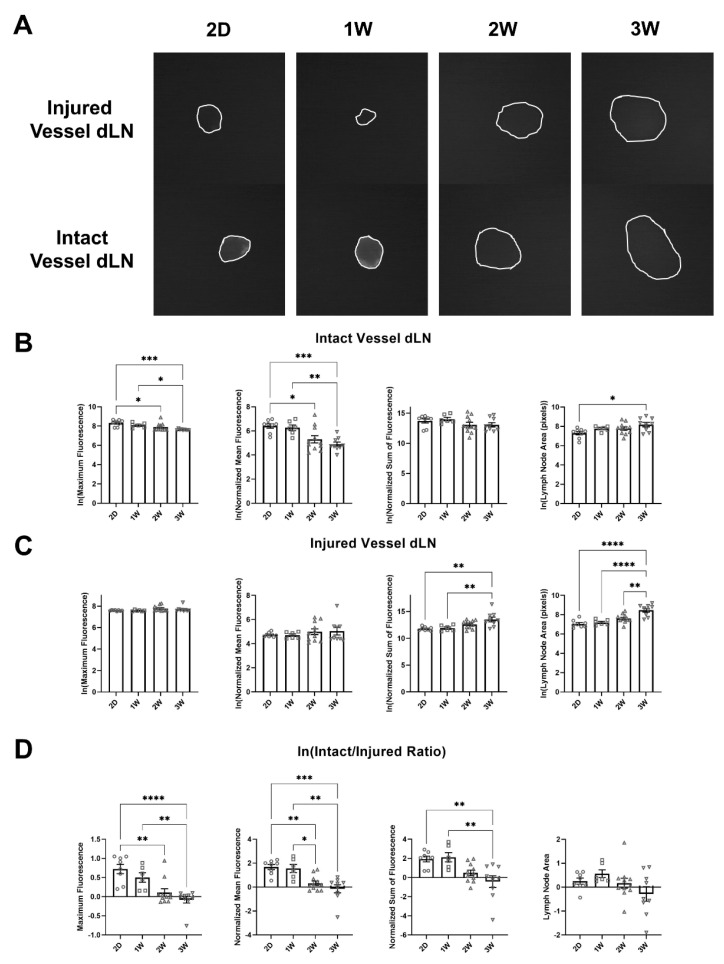
Figure 4.
Lymph-draining nanoparticle accumulation within the intact vessel dLN decreases during lymphedema progression. (A) Fluorescent images of LNs harvested 24 h after injection of nanoparticles conjugated with 680 IR Dye at 2D, 1W, 2W, and 3W timepoints. (B) Natural logarithm of maximum fluorescence, normalized mean fluorescence, normalized sum of fluorescence, and lymph node area for the intact vessel dLN at 2D, 1W, 2W, and 3W timepoints. (C) Natural logarithm of maximum fluorescence, normalized mean fluorescence, normalized sum of fluorescence, and lymph node area for the injured vessel dLN at 2D, 1W, 2W, and 3W timepoints. (D) Natural logarithm of the intact/injured ratio for maximum fluorescence, normalized mean fluorescence, normalized sum of fluorescence, and lymph node area at 2D, 1W, 2W, and 3W timepoint. One-way ANOVA tests with Tukey’s multiple comparisons were used to compare between timepoints for B, C, and D. 2D (n = 8), 1W (n = 6), 2W (n = 11), 3W (n = 9). Mean ± s.e.m. * (p < 0.05), ** (p < 0.01), *** (p < 0.001), **** (p < 0.0001).

