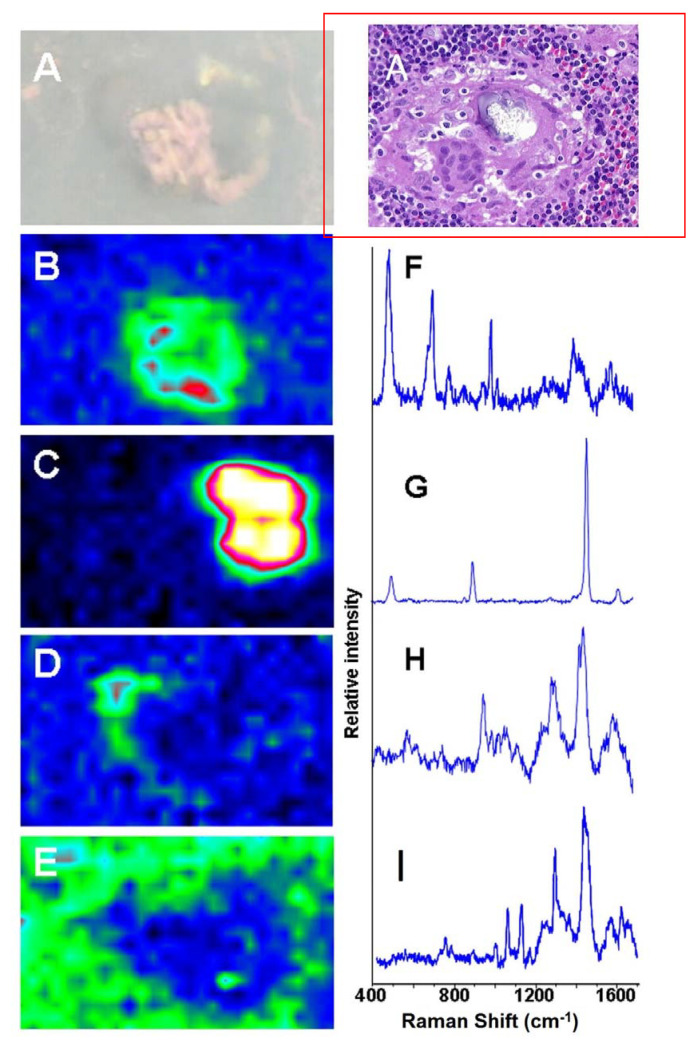
Figure 4.
Raman spectroscopy generated images of silicone migrated to axillary lymph node: (A) white light and HE image; (B) Raman generated image based on the distribution of silicone shown in spectrum (F); (C) Raman image based on distribution of oxalate shown in spectrum (G); (D) Raman image based on the distribution of phosphate shown in spectrum (H); (E) Raman image of tissue around the migrated silicone; (I) Raman spectrum from the tissue surrounding the phenyl silicone and Schaumann body.

