
Figure 2.
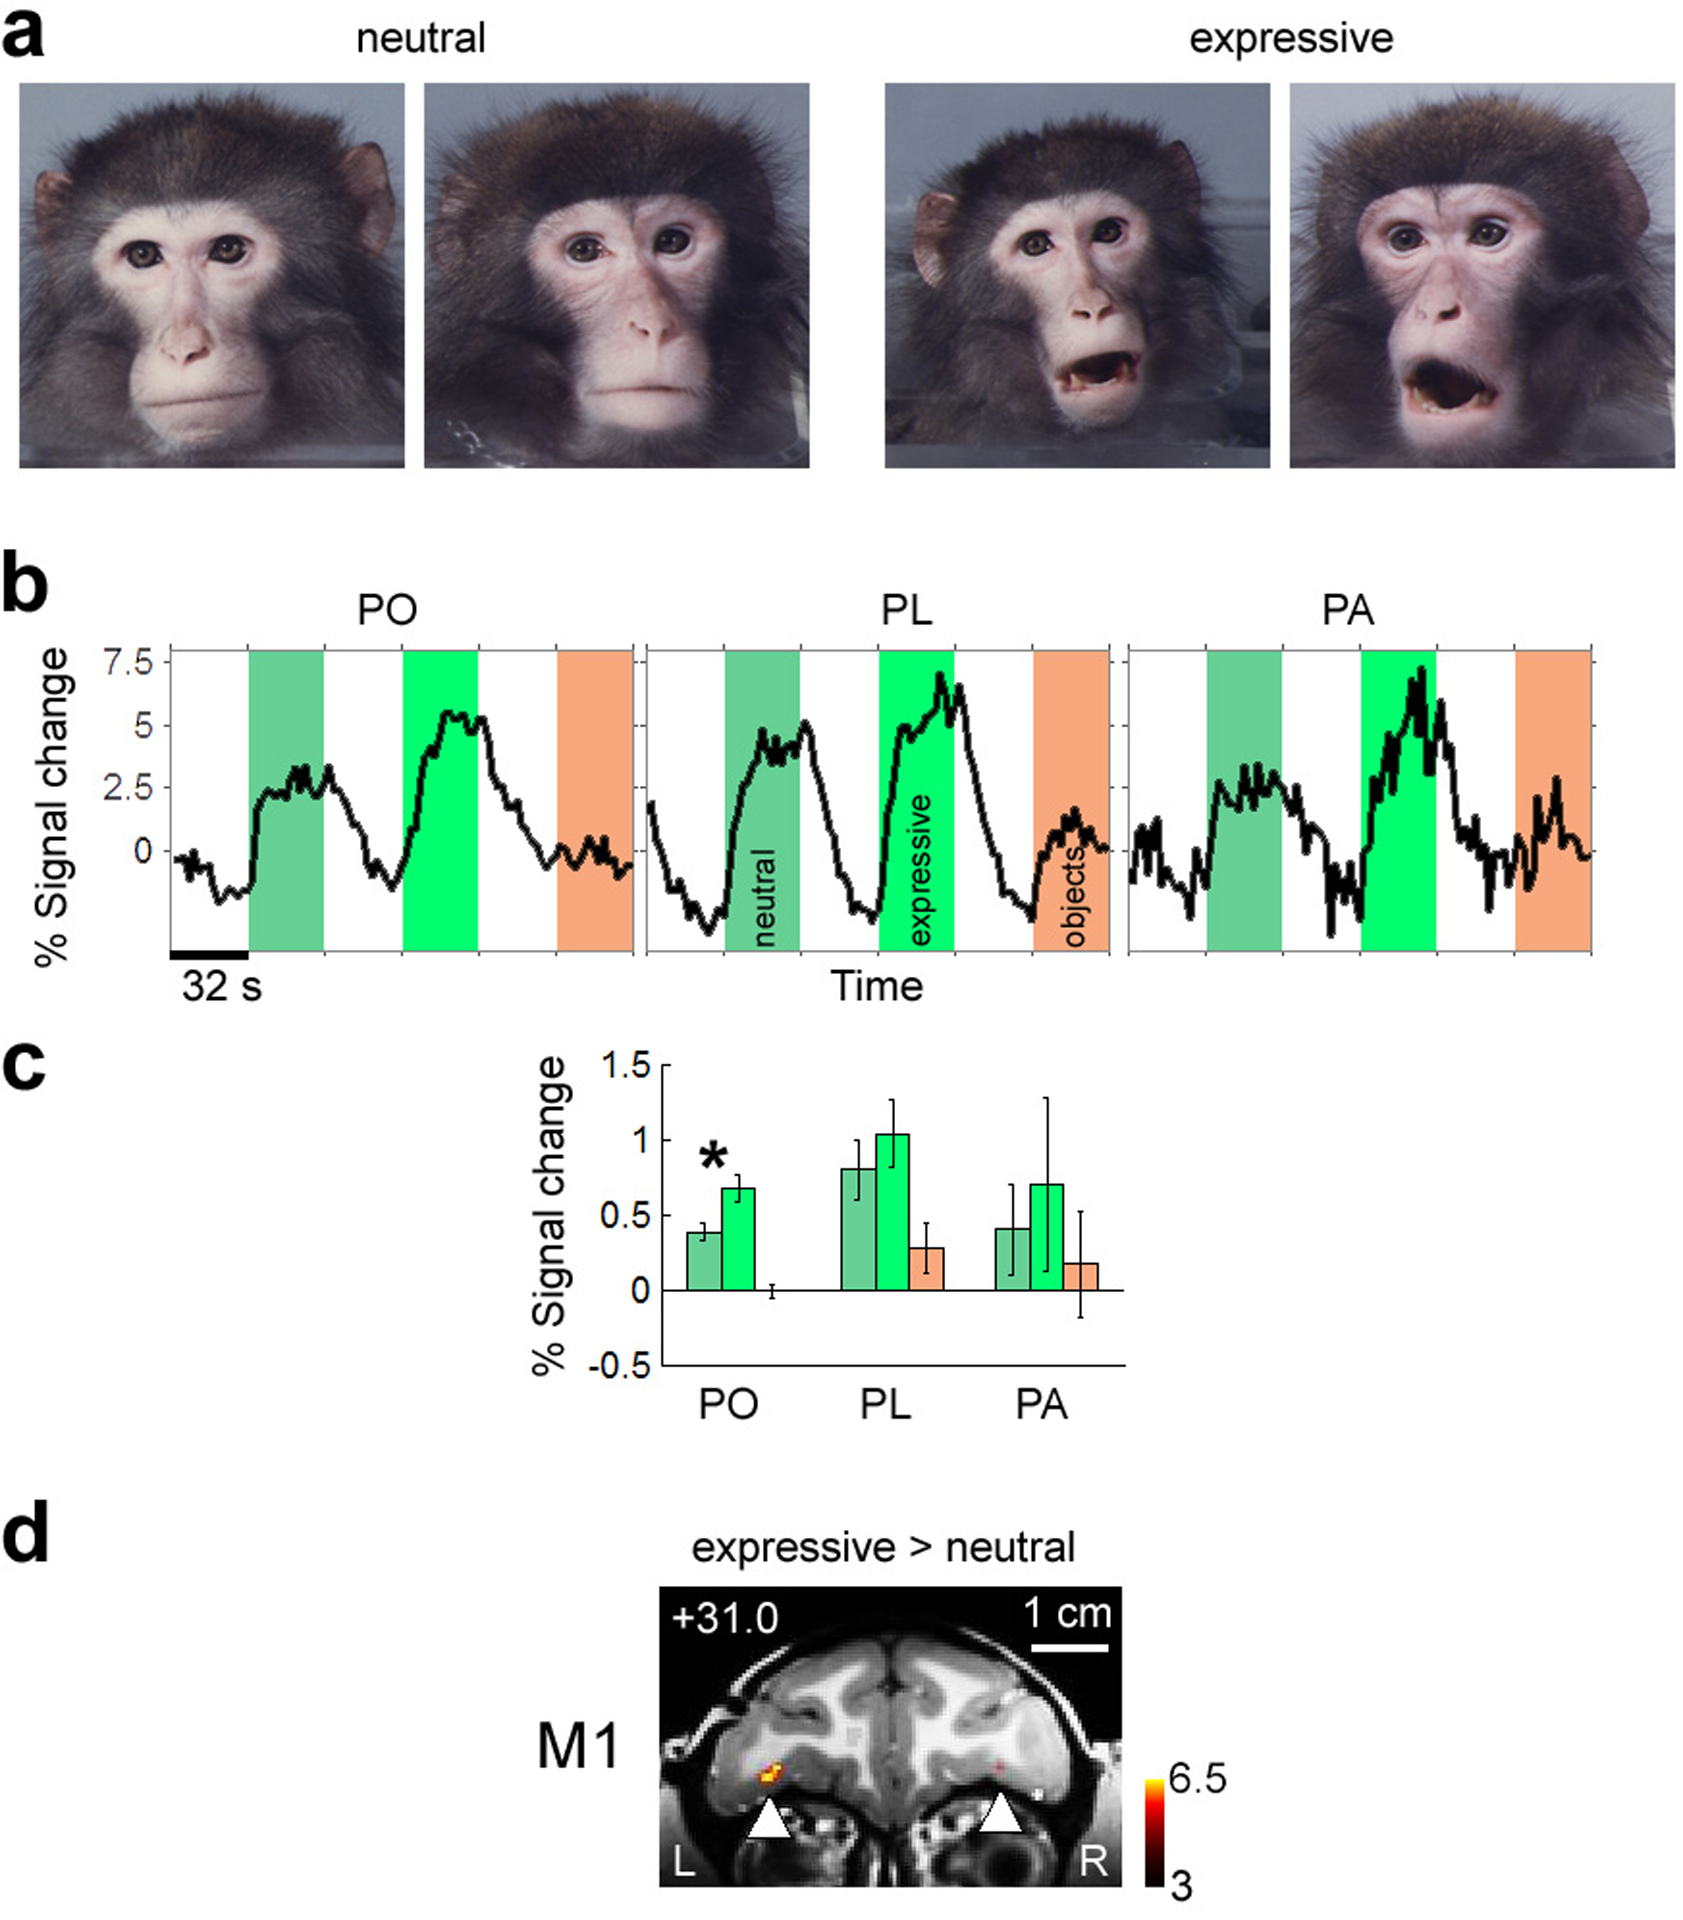
Sensitivity of prefrontal and temporal face patches to facial expression.
a) Example images of neutral and expressive macaque faces used to test selectivity of prefrontal face patches for expressive versus neutral faces.
b) Average time course from PO, PL, and PA to neutral faces (medium grey), expressive faces (light grey), and non-face objects (dark grey). Data averaged across three monkeys (M1, M3, M4).
c) Bar graph showing % fMRI signal change to neutral faces (medium grey), expressive faces (light grey), and non-face objects (dark grey). Data averaged across three monkeys (M1, M3, M4). Error bars indicate 95% confidence intervals.
d) Coronal slice showing activation to expressive versus neutral faces in monkey M1. PO was the only region activated by this contrast at p = 0.001.