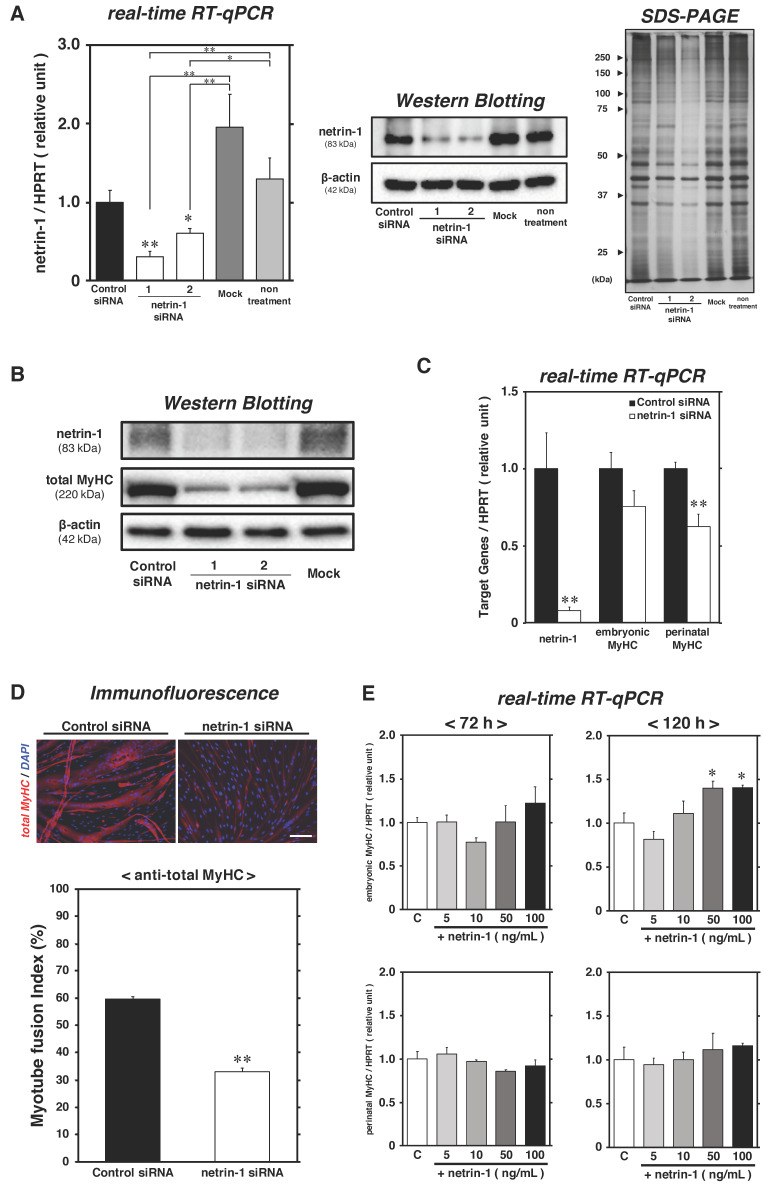
Figure 4.
Myotube formation was regulated by netrin-1 during myogenic differentiation. The satellite cell-derived myoblasts were grown in the PM for 24 h, then the medium was replaced with DM, myoblasts were transfected with netrin-1 siRNAs and were incubated in the DM for up to 72 h or 120 h. (panel A–C) The mRNA expression levels of netrin-1 at 72 h (shown in panel A), netrin-1, embryonic MyHC, and perinatal MyHC at 120 h (shown in panel C) were evaluated by real-time RT-qPCR and normalized to the level of HPRT. The bars depict the mean ± SEM of three independent cultures by relative units, as compared to control siRNA-treated cultures. The protein expression levels of netrin-1 at 72 h (shown in panel A), and those of netrin-1 and total MyHC (shown in panel B) were also detected with Western Blotting using cell lysates; β-Actin was used for protein expression normalization. (panel A right-side image) Following Western Blotting analysis, equivalent amounts of whole cell lysates from each culture group at 72 h were subjected to SDS-PAGE, and subsequently visualized by silver staining. (panel D) Immunofluorescence microscopy for total MyHC (red) and DAPI (blue) shows myotubes and nuclei. Scale bar in panel, 100 μm. Myotube fusion index was evaluated and defined as the ratio of myonuclei on myotubes containing more than two nuclei. The results are expressed as the mean ± SEM of three independent cultures. Significant differences from the means of control siRNA cultures (black bar) at p < 0.05 or p < 0.01 are indicated by single or double asterisks. (panel E) Satellite cell primary cultures, prepared as shown in Figure 2, were differentiated in DM for 48 h after the induction of proliferation. Then, satellite cells were maintained for 24 h or 72 h (beginning at 48 h post-differentiation in DM) in media containing recombinant netrin-1 (0, 5, 10, 50, and 100 ng/mL) and analyzed by real-time RT-qPCR standardized HPRT, for embryonic MyHC and perinatal MyHC mRNAs expression at 72 h or 120 h post-differentiation, respectively. The bars depict the mean ± SEM of three independent cultures by relative units, as compared to control culture. Significant differences from the control culture mean (the left-most open bar) at p < 0.05 is indicated by a single asterisk. C: control culture.

