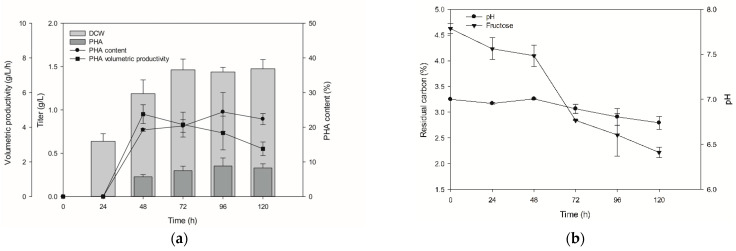
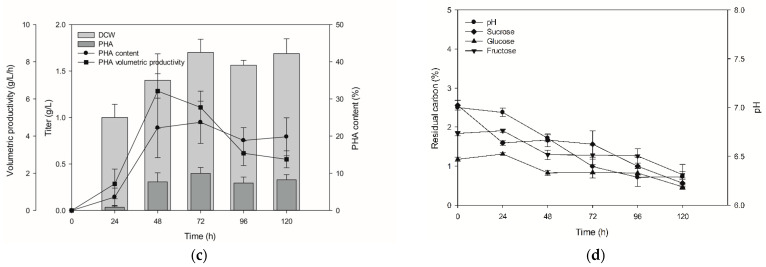
Figure 4.
Monitoring of PHA production at different time points under the application of fructose and fructose syrup. (a) Time-dependent PHA production of Pseudomonas sp. B14-6 with optimized conditions. (b) Measurement of residual fructose and pH. (c) Time-dependent PHA production supplemented with fructose syrup as a carbon source. (d) Time-dependent residual sugars from fructose syrup and pH change. DCW, dry cell weight.


